How To Supercharge AI/ML Observability With OpenTelemetry and Fluent Bit - Celalettin Calis
Celalettin Calis
KubeCon + CloudNativeCon Europe 2025 · Session
Overview
In this insightful KubeCon EU session, Celalettin Calis, a Senior Software Engineer at Chronosphere, presented a compelling case for enhancing AI/ML observability within Kubernetes environments. The talk, titled "How To Supercharge AI/ML Observability With OpenTelemetry and Fluent Bit," addressed the unique and complex challenges of monitoring modern intelligent systems, particularly Large Language Models (LLMs), which often exhibit "invisible intelligence." Calis demonstrated how a powerful combination of OpenTelemetry for standardized telemetry collection and Fluent Bit for efficient data processing and routing can bridge critical observability gaps.
Key moments
- 0:00 Introduction and Kubernetes challenges for AI/ML
- 2:00 Addressing technical gaps in AI/ML observability
- 4:00 Understanding the invisible intelligence challenge in AI/ML
- 6:00 Shortcomings of traditional monitoring for AI/ML systems
- 7:00 Proposing a new observability path for AI/ML
- 8:00 Introduction to OpenTelemetry and Fluent Bit
- 9:30 Integrating Fluent Bit and OpenTelemetry for observability
How To Supercharge AI/ML Observability With OpenTelemetry and Fluent Bit - Celalettin Calis
Speakers: Celalettin Calis, Senior Software Engineer, Chronosphere
Conference: KubeCon EU
YouTube: https://www.youtube.com/watch?v=DVF20OrEFk
Overview
In this insightful KubeCon EU session, Celalettin Calis, a Senior Software Engineer at Chronosphere, presented a compelling case for enhancing AI/ML observability within Kubernetes environments. The talk, titled "How To Supercharge AI/ML Observability With OpenTelemetry and Fluent Bit," addressed the unique and complex challenges of monitoring modern intelligent systems, particularly Large Language Models (LLMs), which often exhibit "invisible intelligence." Calis demonstrated how a powerful combination of OpenTelemetry for standardized telemetry collection and Fluent Bit for efficient data processing and routing can bridge critical observability gaps.
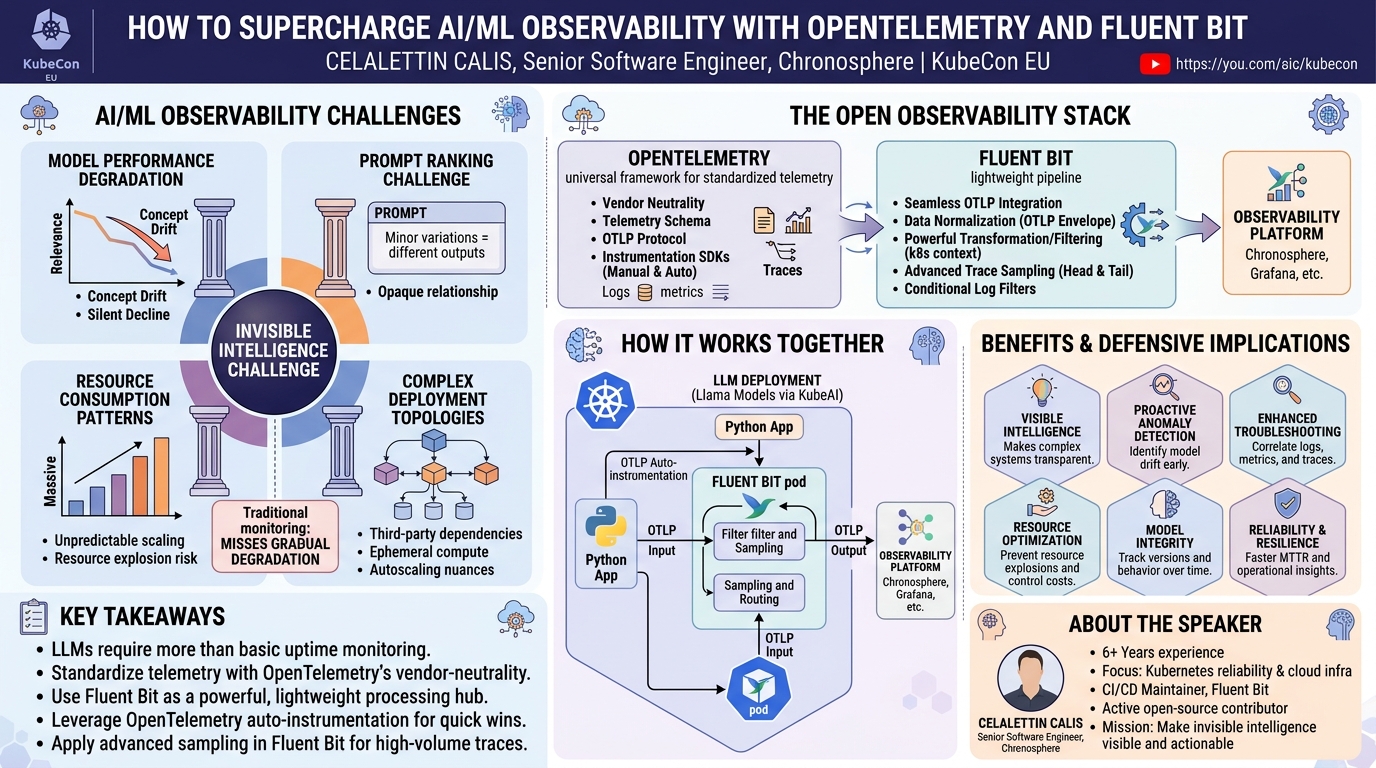
The core of the presentation focused on providing practical strategies for gaining deep visibility into AI/ML workloads. This is crucial given the ephemeral nature of Kubernetes pods, dynamic resource orchestration, and the distinct scaling patterns of training and inference workloads. Beyond these general Kubernetes complexities, AI/ML applications introduce specific issues like model performance degradation, concept drift, prompt ranking challenges, and unpredictable resource consumption, which traditional monitoring tools often fail to capture effectively.
This talk is highly relevant for anyone operating AI/ML workloads on Kubernetes, especially those grappling with the complexities of LLMs. It offers a clear, actionable path to transform opaque AI systems into transparent, observable entities. By leveraging open-source, vendor-neutral tools, Calis illustrated how organizations can move beyond basic "up/down" monitoring to achieve distribution-aware metrics, semantic understanding, contextual correlation, and ultimately, better business alignment for their mission-critical AI applications.
Background
▶ Watch: Introduction and Kubernetes challenges for AI/ML (0:00)
The journey into AI/ML observability on Kubernetes begins by acknowledging the inherent complexities of the platform itself. Kubernetes presents challenges such as ephemeral compute, where pods appear and disappear rapidly, taking their logs and context with them. Resource orchestration dynamically shifts workloads across nodes, making it difficult to maintain a consistent view. Autoscaling for AI/ML is particularly nuanced, as training and inference workloads scale very differently based on their specific patterns. Furthermore, multi-tenancy means deploying multiple ML models on shared infrastructure with varying priorities, leading to resource contention and isolation issues. While solutions exist for these general Kubernetes problems—like external log storage, predictive scaling, and workload isolation—they often fall short when confronted with the specific demands of AI/ML applications.
Calis highlighted several critical technical gaps that plague AI/ML observability. First, achieving unified telemetry collection across heterogeneous components within an ML pipeline is exceptionally difficult. Second, Kubernetes context propagation—maintaining context as requests traverse multiple services—becomes increasingly complex with microservice-based ML architectures. Third, there's a proliferation of ML framework-specific instrumentation, leading to fragmented monitoring solutions. Finally, a significant challenge lies in effectively connecting infrastructure metrics with machine learning outcomes, making it hard to understand the business impact of underlying resource issues. These gaps collectively create "blind spots" that leave ML operations teams struggling to troubleshoot model issues effectively.
This leads to what Calis termed the "invisible intelligence challenge." Mission-critical AI systems, increasingly powering core business operations and relying on LLMs, often operate with an observability gap. Current monitoring tools lag behind the complexity and impact of these systems. A "control problem" further exacerbates this, as system failures may originate from third-party components, creating additional blind spots.
To address this, four critical observability dimensions for AI/ML were outlined:
- Model Performance Degradation: Models can experience a "silent decline," decaying in unpredictable patterns without explicit errors. This includes concept drift, where real-world data diverges from training distributions, and threshold creep, where performance metrics fluctuate within acceptable ranges but failures still occur unnoticed.
- Prompt Ranking Challenge: Especially relevant for LLMs, minor prompt variations can lead to drastically different outputs. The relationship between prompts and responses often remains "opaque" to traditional tools, and managing versioning of models and their associated prompt behaviors adds another layer of complexity.
- Resource Consumption Patterns: AI/ML workloads, particularly LLMs, exhibit resource consumption patterns significantly different from traditional applications. They can consume substantially more resources for the same prompt with different values, leading to potential "resource explosions" if not carefully monitored.
- Complex Deployment Topologies: AI/ML systems often reside in heterogeneous environments, involve third-party dependencies, complex inter-service chains, and cross-boundary data flows, making a holistic view challenging.
Traditional monitoring approaches, which typically rely on simple "up/down" signals or point-in-time metrics, are insufficient. They miss gradual degradation, fail to capture distribution shifts over time, and lack the semantic context necessary to understand model behavior. This has direct business impacts: a recommendation engine with declining relevance leads to decreased click-through rates, LLM hallucination results in incorrect responses, and unchecked resource consumption leads to cost explosions. The path forward, as proposed, requires distribution-aware metrics, semantic understanding, contextual correlation, and strong business alignment in observability strategies.
Key Findings
▶ Watch: Understanding the invisible intelligence challenge in AI/ML (4:00)
The central finding of Celalettin Calis's presentation is that a strategic combination of OpenTelemetry and Fluent Bit provides a robust, open-source, and vendor-neutral solution to overcome the critical observability gaps in AI/ML workloads running on Kubernetes. This integrated approach allows organizations to move beyond reactive troubleshooting to proactive, intelligent monitoring of complex systems, including LLMs.
OpenTelemetry emerges as the foundational element, offering an open-source, vendor-neutral framework for collecting and standardizing all three pillars of telemetry: logs, metrics, and traces. Its first-class Kubernetes integration and strong community adoption make it an ideal choice for cloud-native environments. By providing a common schema, a standardized transport layer (OTLP), and powerful instrumentation SDKs (including auto-instrumentation capabilities), OpenTelemetry ensures consistent data generation across diverse ML frameworks and services. This addresses the problem of fragmented monitoring and facilitates unified telemetry collection.
Fluent Bit, on the other hand, acts as the lightweight, end-to-end observability pipeline that complements OpenTelemetry perfectly. Its ability to collect, transform, enrich, and deliver telemetry data with high efficiency makes it indispensable in Kubernetes. Key capabilities include:
- Seamless OTLP Integration: Fluent Bit can natively consume and deliver logs, metrics, and traces using the OpenTelemetry Protocol (OTLP), acting as a central hub for all telemetry data.
- Data Normalization and Conversion: With its OpenTelemetry Envelope feature, Fluent Bit can convert non-OTLP formatted data (e.g., Prometheus metrics, raw application logs) into the OpenTelemetry schema, ensuring all data conforms to a single standard before processing.
- Powerful Transformation and Filtering: Fluent Bit's capabilities extend to advanced data manipulation, including enrichment with Kubernetes context, conditional filtering of logs, and crucial for AI/ML, intelligent sampling techniques for traces.
- Advanced Sampling for LLMs: For "chatty" applications like LLMs that generate a high volume of traces and spans, Fluent Bit offers sophisticated head sampling and tail sampling mechanisms. These allow for intelligent reduction of trace data while preserving critical information, preventing observability backends from being overwhelmed and managing costs.
Together, OpenTelemetry and Fluent Bit enable semantic understanding and contextual correlation of AI/ML data. They allow practitioners to connect infrastructure performance directly to model behavior, track prompt variations, and monitor resource consumption patterns with unprecedented detail. This combined solution effectively makes "invisible intelligence visible and actionable," transforming the ability of ML operations teams to troubleshoot, optimize, and ensure the reliability of their AI systems.
Technical Deep Dive
▶ Watch: Shortcomings of traditional monitoring for AI/ML systems (6:00)
The technical synergy between OpenTelemetry and Fluent Bit forms the bedrock of this advanced AI/ML observability strategy. Understanding their individual strengths and how they interact is crucial for implementation.
OpenTelemetry serves as the universal language for observability data. It's an open-source project that provides a standardized way to instrument, generate, collect, and export telemetry data—logs, metrics, and traces.
- Vendor Neutrality: A core tenet of OpenTelemetry is its vendor-neutral approach. It abstracts away the specifics of different observability backends, allowing users to switch platforms without re-instrumenting their applications.
- Telemetry Schema: OpenTelemetry defines a consistent schema for logs, metrics, and traces. This standardization ensures that data from various sources is uniformly structured, making it easier to analyze and correlate.
- OTLP (OpenTelemetry Protocol): This is the standardized transport layer for OpenTelemetry data. OTLP is a gRPC-based protocol (also supports Protobuf over HTTP) designed for efficient and reliable transmission of telemetry data. Applications or collectors send data to an OTLP endpoint, which can then forward it to an observability backend.
- Instrumentation SDKs: OpenTelemetry provides Software Development Kits (SDKs) for various programming languages. These SDKs allow developers to instrument their applications manually. Critically for AI/ML, OpenTelemetry also supports auto-instrumentation, where common libraries (like those used in Python for web frameworks or database interactions, or even specific ML libraries like OpenAI) can be instrumented without code changes. This is particularly powerful for complex AI applications built on existing frameworks, significantly reducing the instrumentation burden.
Fluent Bit complements OpenTelemetry by acting as a lightweight, high-performance telemetry processor and router. While OpenTelemetry focuses on generating and standardizing data, Fluent Bit excels at collecting, transforming, enriching, and delivering that data efficiently, especially in containerized environments like Kubernetes.
- End-to-End Observability Pipeline: Fluent Bit can ingest data from a multitude of sources (files, systemd, Kubernetes logs, network protocols) and output to various destinations (Elasticsearch, Kafka, S3, and crucially, OTLP endpoints).
- OTLP Input/Output Plugins: Fluent Bit includes dedicated input and output plugins for OTLP. This means it can receive logs, metrics, and traces directly from applications or OpenTelemetry Collectors via OTLP, and then forward them to an observability platform, also using OTLP. This makes Fluent Bit a central hub for OpenTelemetry data flow.
- OpenTelemetry Envelope: A key feature mentioned is Fluent Bit's ability to convert non-OTLP data into the OpenTelemetry format. For instance, if an application emits logs in a custom JSON format or metrics via Prometheus/StatsD endpoints, Fluent Bit's "OpenTelemetry Envelope" can parse these and convert them into the standardized OpenTelemetry log record or metric format before further processing or export. This ensures all telemetry adheres to the OpenTelemetry schema, even if not originally generated by an OpenTelemetry SDK.
- Powerful Transformation Capabilities: Fluent Bit supports a rich set of filters and processors. It can enrich telemetry data with Kubernetes metadata (pod name, namespace, labels), parse unstructured logs, apply regular expressions for data extraction, and perform data masking or redaction.
- Advanced Sampling for Traces: For "chatty" applications like LLMs that generate a massive number of traces, intelligent sampling is essential to manage volume and cost. Fluent Bit offers:
- Head Sampling: This is a probabilistic approach where a decision to sample a trace is made at the very beginning, based on the first span (the "head span"). If the conditions (e.g., error status, specific attribute values) apply to the head span, the entire trace is sampled and sent; otherwise, the whole trace is dropped. This is efficient as it avoids processing subsequent spans if the trace is not selected.
- Tail Sampling: In contrast, tail sampling waits for all spans of a trace to be collected before applying filtering conditions. This allows for more informed sampling decisions (e.g., only sample traces that contain an error or exceed a certain latency), but it introduces higher latency because the full trace must be buffered. This is valuable when critical traces must be captured based on their entire context.
- Conditional Filters for Logs: Fluent Bit allows for highly granular filtering of log records using conditional operators (e.g.,
AND,OR), comparison operators (e.g.,==,!=,>,<), and regular expressions. This enables users to drop irrelevant logs, retain only critical errors, or route specific log types to different destinations.
In essence, OpenTelemetry provides the standardized language and instrumentation, while Fluent Bit provides the intelligence and efficiency to collect, process, and route that language, particularly adept at handling the unique challenges posed by AI/ML workloads in Kubernetes.
Demo / Proof of Concept
▶ Watch: Introduction to OpenTelemetry and Fluent Bit (8:00)
Celalettin Calis's demonstration effectively showcased the practical application of OpenTelemetry and Fluent Bit for supercharging AI/ML observability. The setup was designed to simulate a real-world LLM deployment on a Kubernetes cluster.
The demo environment consisted of an EKS cluster configured with two GPU nodes, which are essential for running computationally intensive LLM workloads. On this cluster, two specific LLM models were deployed: Llama 8B Instruct and Llama 8B Tulip. These models were made accessible via KubeAI, a project that provides OpenAI-compliant endpoints, allowing applications to interact with them as if they were standard OpenAI services. This abstraction simplifies the application-side integration.
A Python application was then run, whose sole purpose was to send incoming chat requests to these deployed LLMs. Crucially, Calis emphasized that he "didn't use any metric or log or tracing in my code." Instead, the application leveraged OpenTelemetry auto-instrumentation for OpenAI. This meant that without a single line of manual instrumentation code, the application automatically generated comprehensive metrics, traces, and logs for all interactions with the LLMs. This highlights a significant advantage: reduced development overhead and consistent telemetry generation.
The generated telemetry data was then directed to a Fluent Bit OTLP endpoint. The Fluent Bit configuration, shown briefly, included an OpenTelemetry input plugin configured to expose OTLP endpoints for traces, logs, and metrics. This plugin could receive data using either gRPC or Protobuf over HTTP. The Fluent Bit instance then processed this incoming data and, using an OTLP output plugin, forwarded it to a demo observability environment (Chronosphere, though Calis noted that Grafana, DataDog, New Relic, and other open-source solutions are equally compatible). The output plugin was configured with specific URIs for metrics, logs, and traces, along with an API token for authentication. A key detail was the use of set out as an output, indicating that Fluent Bit was also printing processed data to standard output for debugging or verification.
To simulate real-world load and generate observability data, load testers were used to send continuous requests to the Python application, which in turn interacted with the LLMs. The results, visualized on the Chronosphere platform, were compelling:
- Metrics: The dashboard displayed critical performance indicators such as P99 client operation latency, clearly differentiating between the two deployed Llama models. It also showed token usage, indicating, for example, "950 tokens," providing direct insight into the computational cost and model output volume. These metrics were automatically generated with relevant labels, demonstrating the power of auto-instrumentation.
- Traces: Full end-to-end traces were flowing into the observability platform, allowing for detailed inspection of request paths through the Python application and LLM interactions. This enables deep troubleshooting and performance analysis.
- Logs: Generated logs were also visible and, importantly, could be correlated with traces and metrics using shared IDs, providing a holistic view of system behavior.
The demo successfully illustrated that comprehensive AI/ML observability, including detailed metrics, traces, and logs, can be achieved on Kubernetes with minimal manual effort (e.g., "10 lines of YAML" for Fluent Bit configuration) by effectively combining OpenTelemetry auto-instrumentation with Fluent Bit's OTLP processing capabilities.
Defensive Implications
▶ Watch: Integrating Fluent Bit and OpenTelemetry for observability (9:30)
The comprehensive observability strategy outlined by Celalettin Calis, leveraging OpenTelemetry and Fluent Bit, has significant defensive implications for organizations operating AI/ML workloads, extending beyond mere performance monitoring to encompass reliability, security, and operational resilience.
- Proactive Anomaly Detection: By implementing detailed monitoring of AI/ML systems, defenders can proactively detect anomalies that might signal model degradation, concept drift, or even malicious activity. For instance, sudden shifts in token usage, unexpected changes in P99 client operation latency, or unusual patterns in prompt-response data can indicate a problem before it cascades into a critical incident. This moves organizations from reactive firefighting to proactive threat and performance management.
- Enhanced Troubleshooting and Root Cause Analysis: The ability to correlate logs, metrics, and traces across the entire AI/ML pipeline—from the application layer to the underlying Kubernetes infrastructure and even third-party LLM services—is invaluable. If an LLM starts hallucinating or a recommendation engine experiences a gradual relevance decline, engineers can use the correlated telemetry to pinpoint the exact service, model version, or even specific prompt causing the issue. This drastically reduces mean time to resolution (MTTR) for both operational and potential security incidents.
- Resource Optimization and Cost Control: The talk highlighted the risk of "resource explosion" with AI/ML workloads. Detailed resource consumption metrics provided by this observability stack enable organizations to understand and optimize the resource footprint of their models. Defenders can identify inefficient models, detect resource exhaustion patterns that could lead to denial-of-service (DoS) or performance issues, and implement smarter scaling strategies, thereby controlling costs and maintaining system stability.
- Model Integrity and Security Posture: While not a security talk, robust observability inherently strengthens the security posture of AI/ML systems. Monitoring prompt variations and model outputs can help detect prompt injection attacks or subtle adversarial attempts to manipulate model behavior. Tracing data flows can identify unauthorized access or data exfiltration attempts within the ML pipeline. The ability to track model versions and their performance over time also contributes to model integrity, ensuring that deployed models are behaving as expected and haven't been tampered with.
- Compliance and Auditability: Comprehensive telemetry collection provides an immutable audit trail of how AI/ML models operate, how they respond to various inputs, and their resource consumption. This level of detail is increasingly crucial for regulatory compliance, especially in sensitive industries where model explainability and accountability are mandated. The ability to reconstruct the context around any model decision or system state is a powerful defensive capability.
- Improved Reliability and Resilience: By making "invisible intelligence visible," organizations can build more reliable and resilient AI/ML systems. Understanding the complex interdependencies and failure modes of these systems allows for better architectural design, more effective chaos engineering experiments, and the implementation of automated remediation strategies based on observable conditions. This ensures that critical AI-powered business operations remain stable and performant.
In essence, the adoption of OpenTelemetry and Fluent Bit for AI/ML observability transforms these complex systems from black boxes into transparent, manageable entities. This transparency is a fundamental defensive measure, empowering teams to identify, mitigate, and prevent a wide array of operational, performance, and security challenges unique to the AI/ML landscape.
Key Takeaways
- AI/ML systems, especially LLMs, introduce unique observability challenges that go beyond traditional application monitoring, including silent performance degradation, concept drift, prompt ranking complexities, and unpredictable resource consumption patterns.
- OpenTelemetry provides a standardized, vendor-neutral framework for collecting all three pillars of telemetry (logs, metrics, and traces) with first-class Kubernetes integration, offering a unified language for observability data.
- Fluent Bit acts as a powerful, lightweight observability pipeline that efficiently collects, transforms, enriches, and routes OpenTelemetry data, serving as a central hub for telemetry within Kubernetes environments.
- Combining OpenTelemetry auto-instrumentation with Fluent Bit's OTLP capabilities enables comprehensive AI/ML observability on Kubernetes with minimal manual effort, significantly reducing the burden of instrumentation on developers.
- Advanced sampling techniques like head and tail sampling in Fluent Bit are crucial for managing the high volume of telemetry generated by "chatty" LLM applications, preventing observability backends from being overwhelmed and controlling costs.
- This integrated approach helps address critical issues such as model performance degradation, resource explosion, and opaque prompt-response relationships, ultimately leading to improved reliability, better troubleshooting, and stronger business alignment for AI-powered applications.
About the Speaker(s)
Celalettin Calis is a Senior Software Engineer at Chronosphere, an observability platform. With over six years of dedicated experience, his professional focus has been on Kubernetes reliability and cloud infrastructure. He is an active open-source contributor and notably serves as a CI/CD maintainer for Fluent Bit, a testament to his expertise in the observability space. Calis is a familiar presence on Fluent Bit's Slack channels, demonstrating his commitment to the community. His personal mission is to make "invisible intelligence visible and actionable for everyone," reflecting his passion for bringing clarity and understanding to complex, intelligent systems.
Reviews
Dr. Zero (Offensive Security Researcher) — STRONG ACCEPT
Calis delivers a highly relevant and technically sound session on tackling the increasingly complex observability challenges of AI/ML workloads, particularly LLMs, within Kubernetes. By demonstrating a practical, vendor-neutral approach leveraging OpenTelemetry and Fluent Bit, he provides actionable strategies for gaining deep visibility into systems often plagued by 'invisible intelligence.' This isn't just another 'observability 101' talk; it's a focused deep-dive into solving specific, critical problems for ML operations teams.
Heather Calloway (CISO) — STRONG ACCEPT
This session by Celalettin Calis at KubeCon EU presents a highly credible and actionable strategy for achieving robust observability in AI/ML workloads, particularly LLMs, on Kubernetes. By leveraging OpenTelemetry and Fluent Bit, the talk provides a clear path to transform opaque AI systems into transparent, manageable entities. While primarily focused on operational reliability, the detailed technical approach and demonstrated business impacts make this a valuable session for security leaders grappling with the unique risks of AI deployment.