How To Rename Metrics Without Impacting Somebody’s Observabili... Bartłomiej Płotka & Arianna Vespri
Bartłomiej Płotka, Arianna Vespri
KubeCon + CloudNativeCon Europe 2025 · Session
Overview
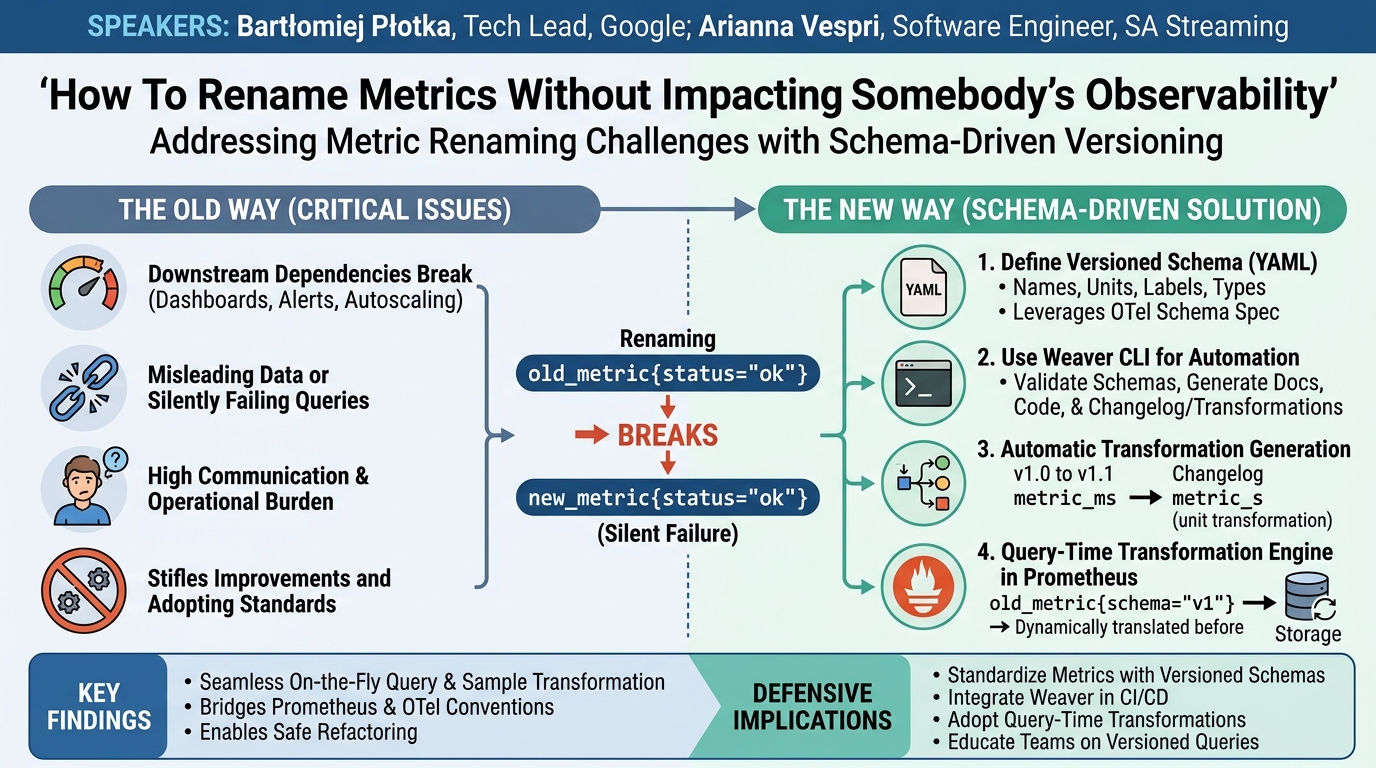
Renaming metrics, a seemingly innocuous refactoring task, is a pervasive and often dreaded challenge in modern observability systems. This talk by Bartłomiej Płotka and Arianna Vespri at KubeCon EU addresses the critical problem of how metric renames can silently break production systems, leading to incidents, unreliable dashboards, and failed autoscaling. They highlight that such changes, even minor ones like label value adjustments or unit conversions, can cause significant friction for both metric producers (maintainers fearful of making necessary improvements) and consumers (users whose alerts and dashboards suddenly cease to function correctly).
Key moments
- 0:00 Introduction: Renaming metrics causes production incidents
- 2:00 Vision: Pinning metric versions like code dependencies
- 2:40 Talk outline: Why, current state, and future solutions
- 4:20 Defining what 'metric renaming' encompasses
- 4:50 Challenges: Breaking queries, dashboards, and distributed systems
- 6:10 Why metric renames are inevitable and necessary
How To Rename Metrics Without Impacting Somebody’s Observability
Speakers: Bartłomiej Płotka, Tech Lead, Google; Arianna Vespri, Software Engineer, SA Streaming
Conference: KubeCon EU
YouTube: https://www.youtube.com/watch?v=Rw4c7lmdyFs
Overview
Renaming metrics, a seemingly innocuous refactoring task, is a pervasive and often dreaded challenge in modern observability systems. This talk by Bartłomiej Płotka and Arianna Vespri at KubeCon EU addresses the critical problem of how metric renames can silently break production systems, leading to incidents, unreliable dashboards, and failed autoscaling. They highlight that such changes, even minor ones like label value adjustments or unit conversions, can cause significant friction for both metric producers (maintainers fearful of making necessary improvements) and consumers (users whose alerts and dashboards suddenly cease to function correctly).
The core of their presentation is a groundbreaking prototype that leverages existing components within the Cloud Native Computing Foundation (CNCF) ecosystem, particularly OpenTelemetry schema definitions and the Weaver CLI, to introduce a schema-driven, versioned approach to metrics. This innovative solution aims to enable seamless, on-the-fly transformations of metrics at query time, allowing consumers to pin their queries to specific metric versions while producers can evolve their metric definitions without causing widespread outages. The speakers present this as a "truly magical" way to manage metric evolution, akin to how code dependencies or database schemas are versioned.
The talk is highly relevant for anyone involved in operating or developing applications within a Prometheus or OpenTelemetry-centric observability stack. It offers a pragmatic path forward for an industry that has long struggled with the rigidity of metric naming, proposing a robust framework that promises to reduce operational burden, enhance system reliability, and foster better collaboration between metric producers and consumers. By demonstrating how a backend like Prometheus could dynamically adapt to metric changes, Płotka and Vespri lay the groundwork for a more flexible and resilient observability landscape.
Background
▶ Watch: Introduction: Renaming metrics causes production incidents (0:00)
The problem of renaming metrics is far more complex than it appears on the surface, primarily because metrics are deeply embedded into the operational fabric of systems. When a metric name, label, or even a label value changes, it breaks every downstream dependency, including critical user queries, dashboards, recording rules, alerts, and autoscaling configurations. This isn't just an inconvenience; it can directly lead to production incidents, as crucial operational insights disappear or automated systems fail to react correctly. The speakers emphasize that the issue is not merely that queries crash, but that they might silently return incorrect or incomplete data, a "much worse scenario to be in."
Communicating such changes effectively and in a timely manner to all end-users is a monumental task, especially in large, distributed systems. Even with generous grace periods, some users will inevitably be caught by surprise, and the extent of the consequences is often unpredictable. The distributed nature of modern architectures further complicates matters, requiring synchronized fixes across client instrumentation, collection, storage, and consumption layers.
Despite these challenges, renaming metrics is often an unavoidable necessity. The talk outlines several compelling reasons:
- Adopting new recommendations and naming conventions: This includes adhering to base units (e.g., seconds instead of milliseconds) and standard suffixes (e.g.,
_total,_bucket). - Switching or aligning metric ecosystems: Moving between Prometheus and OpenTelemetry, for instance, often reveals incompatible naming syntax (e.g., OpenTelemetry's use of dots vs. Prometheus's underscores, or the presence/absence of suffixes).
- Avoiding collisions with reserved suffixes: In some client libraries, like Prometheus client Java, certain suffixes (e.g.,
_created) are automatically trimmed, potentially leading to name collisions if not handled carefully. - Improving semantic clarity: Sometimes, a metric's original name might be misleading or poorly convey its actual meaning. An example cited from
client-gowasgo_gc_duration_seconds, which misleadingly suggested it measured the full garbage collection cycle duration when it only measured the "stop the word" phase. While the maintainers wanted to rename it for clarity, they were "scared" of the repercussions for the vast user base.
The speakers then categorize existing strategies to mitigate the effects of metric renames, highlighting their significant drawbacks:
- No Change Strategy: Projects with large user bases, like
client-go, OpenTelemetry semantic conventions, and Kubernetes SIG instrumentation, often employ stability tests to prevent automatic propagation of changes. While this avoids breakage, it stifles necessary improvements and semantic corrections. - Documented Change: Generating documentation (e.g., from Kubernetes SIG instrumentation or OpenTelemetry semantic conventions) provides a centralized source of truth and communication. However, it doesn't automate the practical work; users still have to manually update their queries and systems.
- Translate Old Versions: Using mechanisms like Prometheus's
metric_relabel_configor DataDog's Vector to rewrite metric labels at ingestion. This achieves a consistent name in storage but is superficial, affecting only metadata and not sample values. It also complicates switching between write-time and query-time transformations. - Write All Known Versions: Employing recording rules (e.g., Prometheus
record_new_rule) to store both old and new metric names simultaneously. This allows for a gradual transition but incurs double storage costs and a significant, manual operational burden, especially with multiple updates over time. - Versioned Read: Requiring users to update queries with
oroperators (e.g.,old_metric OR new_metric) orlabel_replacefunctions to account for multiple metric versions. While theoretically avoiding write-time changes and double storage, this approach is highly manual, complex, prone to inaccuracies (especially during transitions), and impossible to assert for all consumers.
The critical insight from this analysis is that while no current strategy is truly seamless, the Versioned Read approach holds the most potential if it can be made automatic and abstract away the PromQL complexities from the end-user. This forms the foundation for their proposed solution.
Key Findings
▶ Watch: Talk outline: Why, current state, and future solutions (2:40)
The central finding of Płotka and Vespri's talk is the feasibility of implementing seamless metric renames through a schema-driven, versioned approach that leverages existing and emerging CNCF ecosystem components. Their prototype demonstrates that it is possible to automatically translate metric queries on the fly, allowing producers to evolve metric definitions without breaking consumer dashboards, alerts, or autoscaling.
The key discoveries and contributions include:
- Schema as the Source of Truth: Establishing a formal, versioned schema (e.g., a YAML file) that defines metric names, units, label names, label values, and types. This schema is crucial for generating documentation, validating metric definitions, and, most importantly, enabling automatic transformations.
- OpenTelemetry Schema Integration: The realization that the existing OpenTelemetry schema specification can serve as the foundation for defining Prometheus metrics, despite initial naming convention differences. This avoids reinventing the wheel and leverages a standardized, widely adopted telemetry schema.
- Weaver CLI for Automation: Identifying and utilizing the Weaver CLI, an OpenTelemetry tool written in Rust, as a powerful engine for processing these schemas. Weaver can validate schemas, generate documentation, generate SDK code (e.g., type-safe Go client code), and critically, generate the necessary transformation logic between different metric versions.
- Transformation/Changelog Generation: The ability to automatically generate a "transformation" or "changelog" file that captures how a metric evolves from one version to another. This logic supports complex changes, including metric name changes, unit changes (which require value transformations), label name changes, and label value changes. Future potential for label splits and merges is also noted.
- Query-Time Transformation Engine: The proposal and implementation of a schema engine within the Prometheus backend. This engine intercepts PromQL queries, interprets schema version references, fetches the appropriate transformation logic, and performs on-the-fly conversions of metric selectors and sample values before they hit the storage layer. This ensures that a query written for an old metric version can still retrieve and correctly interpret data from a new metric version.
- Schema Reference Syntax: Introducing a method for consumers to explicitly reference a metric's schema and version within their PromQL queries (e.g.,
old_metric_name{schema="[email protected]"}). This provides the necessary context for the transformation engine. - Bridging Ecosystems: The solution's ability to support both Prometheus and OpenTelemetry naming conventions simultaneously. A single semantic metric can have two versions, one adhering to Prometheus standards (underscores, suffixes) and another to OpenTelemetry standards (dots, no suffixes), allowing users to choose their preferred representation.
These findings collectively present a robust, automated solution to a long-standing problem in observability, moving beyond manual workarounds to a programmatic, version-controlled approach.
Technical Deep Dive
▶ Watch: Defining what 'metric renaming' encompasses (4:20)
The proposed solution hinges on three fundamental pillars: a schema definition and transformation mechanism, a reference syntax for linking metrics to schemas, and a schema engine implementation within the observability backend.
Schema Definition and Transformation
The first step is to define a formal schema for metrics. This schema, ideally in a YAML format, captures critical metadata that can change over time:
- Metric Name: The primary identifier.
- Unit: The unit of measurement (e.g., seconds, milliseconds), which is crucial for value transformations.
- Label Names: The keys of labels associated with the metric.
- Label Values: Potentially a set of known, expected values for specific labels.
- Type: The metric type (e.g., counter, gauge, histogram).
This schema is not just for documentation; it's a machine-readable definition that can be versioned, much like code or database schemas. The benefits are numerous:
- Automated Documentation: Generate up-to-date documentation for all metrics.
- Validation: Ensure metrics adhere to organizational standards and conventions.
- SDK Code Generation: Automatically generate type-safe SDK code for various programming languages (e.g., Go). This generated code can be faster, reduce boilerplate, and significantly lower the chance of instrumentation errors compared to manual string-based label definitions.
Crucially, when a metric's definition changes (e.g., a rename), this is captured as a new schema version (e.g., from v1.0 to v1.1). From these versioned schemas, a transformation or changelog file is automatically generated. This file encodes the logic required to upgrade or downgrade the metric's shape between versions. The transformation logic is robust enough to handle:
- Metric name changes.
- Unit changes: This is particularly complex as it requires not just renaming but also value transformation (e.g., converting milliseconds to seconds).
- Label name changes.
- Label value changes.
- Future potential for label splits (one label becomes two) and label merges (two labels become one).
The speakers emphasize designing this transformation format for efficiency, allowing backends to quickly look up and apply transformations on the fly.
OpenTelemetry Ecosystem Integration
A significant aspect of the proposal is the strategic reuse of existing CNCF projects:
- OpenTelemetry Schema Spec: Instead of creating a new schema specification, the talk proposes leveraging the OpenTelemetry (OTel) schema. OTel already provides a standardized, rich schema specification for all telemetry types (metrics, traces, logs) and defines hundreds of reusable metrics. While OTel uses "attributes" instead of "labels" and "instruments" instead of "metric types," the speakers suggest that an overlay or a special flag in the OTel tooling (e.g., a
simpleflag in Weaver) could make it pragmatic for Prometheus users. - Weaver CLI: The Weaver CLI, an OpenTelemetry tool written in Rust, is presented as the cornerstone for automating schema operations. Weaver is capable of:
- Validating schemas.
- Generating documentation.
- Generating code (SDKs).
- Generating transformations.
This tool is already mature and flexible, making it ideal for the proposed workflow.
Reference Syntax and Schema Engine
To make this system work, there needs to be a way to link observed metrics to their schema versions and for users to reference these versions in queries:
- Schema URL/ID: OpenTelemetry already has the concept of a Schema URL, which points to the schema definition (e.g., a GitHub repository URL with a version). This URL can be used as a special label on metrics (e.g.,
__schema_url__="github.com/org/repo/[email protected]"). - PromQL Integration: Users would then pin their queries to a specific schema and version using a special selector in PromQL. For instance, instead of querying
old_metric_name, they would queryold_metric_name{schema="[email protected]"}. This special selector signals to the backend that a transformation might be needed. The speakers suggest a future evolution towards a more efficient Schema ID instead of a full URL.
The final piece is the Schema Engine implementation within the Prometheus backend (or any compatible observability backend). This engine is envisioned as a transparent component situated between the PromQL query engine and the storage layer. Its function is:
- Intercept Queries: When a query with a schema selector comes in, the engine intercepts it.
- Fetch Transformation: It uses the schema URL/ID and the target metric name to look up the appropriate transformation logic from the generated changelog file.
- Translate Matchers: It translates the metric name and label matchers in the query from the requested schema version to the actual version stored in the backend.
- Transform Samples: If necessary (e.g., for unit conversions), it transforms the raw sample values retrieved from storage back into the units and format expected by the queried schema version.
This entire process occurs on the fly, making the metric rename transparent to the consumer. The application can gradually adopt the new metric version, and the consumption layer will continue to work correctly throughout the transition.
Demo / Proof of Concept
▶ Watch: Challenges: Breaking queries, dashboards, and distributed systems (4:50)
The talk included a compelling live demonstration of the prototype, showcasing the practical application of the schema-driven metric versioning. The demo effectively illustrated the problem and the proposed solution's elegance.
The scenario began with a broken query due to a metric rename. An old metric, old_metric, had been updated to new_metric, and its labels integer and category were renamed to my_number and class respectively. When the original query was executed, it returned no data, simulating a production incident.
First, the speakers demonstrated the current, manual workaround: using the or operator in PromQL to combine queries for both the old and new metric names and label sets. This approach, old_metric OR new_metric, was shown to be complex, verbose, and problematic, as it resulted in different series that were difficult to aggregate or use consistently, especially when label names conflicted. It underscored the manual burden and inaccuracy of existing methods.
Next, the proposed solution was introduced. Instead of manual or statements, the user could simply modify their query to include a schema reference. For example, old_metric{schema="old_metric_schema@v1"}. Upon executing this query, the system immediately returned the correct data, seamlessly transforming the underlying new_metric data to match the v1 schema definition. This demonstrated the core capability of on-the-fly, transparent transformation.
The demo further illustrated flexibility by showing how a consumer could then easily upgrade their query to a newer schema version. By changing the query to new_metric{schema="new_metric_schema@v2"} and updating the label names to my_number and class, the system continued to work, fetching data aligned with the latest metric definition. This highlighted the ability to evolve consumption alongside production, but with backward compatibility.
A particularly impressive part of the demo involved a histogram metric with a unit change. The original metric, old_metric_ms_bucket, was in milliseconds, while the new version, new_metric_s_bucket, was in seconds. Querying for old_metric_ms_bucket{schema="old_schema@v1"} would yield values in milliseconds. However, when the query was changed to old_metric_ms_bucket{schema="new_schema@v2"} (implicitly requesting the seconds unit), the system not only matched the correct metric but also transformed the sample values from milliseconds to seconds on the fly. This confirmed that the transformation engine could handle complex value conversions, a critical feature for maintaining data integrity across unit changes. The speakers confirmed that the application was still exposing v1.0 metrics, but the system translated them to v1.2 on demand, showcasing powerful backward compatibility.
The demo concluded by emphasizing that the "source of those possibilities" was the transformation file, which allowed Prometheus to dynamically map query matchers to stored data and translate results back to the desired version.
Defensive Implications
▶ Watch: Why metric renames are inevitable and necessary (6:10)
The schema-driven metric versioning system proposed by Bartłomiej Płotka and Arianna Vespri offers profound defensive implications for organizations relying on Prometheus and OpenTelemetry for observability. Adopting this approach can significantly enhance the resilience and maintainability of monitoring infrastructure.
Here's what defenders should consider and implement:
- Standardize Metric Definitions with Schemas: Organizations should adopt formal, versioned schemas for all critical metrics. This provides a single source of truth, improves clarity, and enables automated validation. Leveraging the OpenTelemetry schema specification is a pragmatic choice, as it's a standardized, evolving part of the CNCF ecosystem.
- Integrate Weaver CLI into CI/CD: The Weaver CLI should be integrated into the continuous integration/continuous deployment (CI/CD) pipelines. This ensures that any changes to metric schemas are automatically validated, documentation is generated, and, crucially, the necessary transformation files are created and stored alongside the schemas. This automation prevents manual errors and ensures that the transformation logic is always up-to-date.
- Advocate for and Adopt the Prometheus Schema Engine: Defenders should engage with the Prometheus community to support the integration of the proposed schema engine into the core Prometheus project. Once available, deploying Prometheus instances with this engine enabled will be paramount to leveraging the full benefits of dynamic query-time transformations.
- Educate Teams on Versioned Queries: Developers and SREs responsible for creating dashboards, alerts, and autoscaling rules need to be educated on how to use the new schema reference syntax in PromQL. By pinning their queries to a specific schema version (e.g.,
metric_name{schema="[email protected]"}), they can insulate their consumption from future metric renames by producers. - Enable Safer Metric Refactoring: This system empowers metric producers (application developers, library maintainers) to refactor and improve metric names, labels, and units without fear of causing widespread outages. This leads to cleaner, more semantically accurate metrics over time, which in turn improves the overall clarity and utility of observability data.
- Facilitate Gradual Transitions and Ecosystem Bridging: The ability to support both old and new metric definitions, and even different naming conventions (Prometheus vs. OpenTelemetry), allows for much smoother transitions. Organizations migrating between systems or trying to unify different telemetry standards can do so incrementally, reducing the "big bang" risks associated with such changes.
- Reduce Operational Burden and Incident Risk: By automating the handling of metric renames, the operational burden on SREs and platform teams is drastically reduced. The risk of production incidents caused by broken alerts or dashboards due to metric changes is minimized, leading to more stable and reliable systems.
- Improve Observability Data Quality: The ability to easily rename misleading metrics (like the
go_gc_duration_secondsexample) promotes better data quality and understanding. Clearer metric names lead to fewer misinterpretations and more effective troubleshooting.
In essence, this solution transforms metric renames from a high-risk, manual chore into a manageable, automated process, significantly bolstering the defensive posture of any organization reliant on metrics for operational intelligence.
Key Takeaways
- Metric Renames are a Critical, Unsolved Problem: Renaming metrics, labels, or units frequently breaks dashboards, alerts, and autoscaling, leading to production incidents and significant operational friction for both producers and consumers.
- Schema-Driven Versioning is the Solution: A formal, versioned schema (e.g., YAML) defining metric metadata (name, unit, labels, type) is the foundational requirement for enabling seamless metric evolution.
- Leverage OpenTelemetry and Weaver CLI: The existing OpenTelemetry schema specification provides a standardized definition, and the Weaver CLI (an OpenTelemetry tool) offers powerful automation for schema validation, code generation, and crucial transformation file generation.
- On-the-Fly Query-Time Transformations: A Prometheus-based schema engine can dynamically translate queries and sample values between different metric versions, allowing consumers to pin to an old version while producers deploy new ones without disruption.
- Support for Complex Transformations: The system handles intricate changes, including metric name changes, label renames, and unit conversions that necessitate value transformations (e.g., milliseconds to seconds).
- Bridge Prometheus and OpenTelemetry Naming: The solution can simultaneously support both Prometheus (underscores, suffixes) and OpenTelemetry (dots, no suffixes) naming conventions for the same semantic metric, facilitating ecosystem convergence.
About the Speaker(s)
Bartłomiej Płotka (Bartekch) is a Tech Lead at Google, where he works on the Google Managed Prometheus service. He is a prominent maintainer of the Prometheus project and several ecosystem projects, including client-go. Bartłomiej is also a co-author of the Thanos project, an active contributor to the CNCF, and the author of the book "Efficient Go." He is passionate about efficient and pragmatic solutions and has recently taken up motorcycling as a hobby.
Arianna Vespri is a Prometheus maintainer and, at the time of the talk, was a Software Engineer at SA Streaming. She brings a unique background from the music business to the tech world, with passions outside of coding including synthesizers and the history of art. Her involvement in the Prometheus project highlights her dedication to open-source and improving observability tooling.
Reviews
Dr. Zero (Offensive Security Researcher) — MUST SEE
This talk by Bartłomiej Płotka and Arianna Vespri presents a truly innovative and pragmatic solution to the long-standing, painful problem of metric renames in observability systems. By leveraging OpenTelemetry schemas and the Weaver CLI, they propose a schema-driven, versioned approach that enables seamless, on-the-fly query-time transformations of metrics, including complex unit conversions. This research offers a robust framework to eliminate operational friction and incidents caused by metric evolution, representing a significant leap forward for anyone operating or developing within a Prometheus or OpenTelemetry-centric environment.
Heather Calloway (CISO) — STRONG ACCEPT
This session addresses a pervasive and often silently crippling operational problem: the fragility of metric renames. The proposed schema-driven, versioned approach using OpenTelemetry and Weaver CLI is a pragmatic and robust solution. It directly enhances system reliability, reduces the risk of production incidents stemming from broken observability, and empowers platform teams to manage critical monitoring infrastructure more effectively. While the technical depth is significant, the implications for operational resilience and incident response are clear and highly valuable for any CISO whose organization depends on modern observability stacks.