OpenTelemetry Project Update
KubeCon + CloudNativeCon Europe 2025 · Session
Overview
This talk provides a comprehensive update on the OpenTelemetry project, highlighting its significant growth, ongoing developments, and strategic roadmap. Presented by key members of the OpenTelemetry Governance Committee (GC), including Alolita Sharma from Apple, Daniel Gomez Blanco from New Relic, Austin Parker from Honeycomb, Tras Stalaker from Microsoft, and Pablo Bayans from Datadog, the session offers deep insights into the project's evolution as a cornerstone of cloud-native observability. It covers community milestones, advancements in core features like profiling and structured logging, the stabilization of semantic conventions, and critical updates to the OpenTelemetry Collector.
Key moments
- 0:00 Introduction and project overview
- 2:00 Phenomenal growth: 7,000+ contributions weekly
- 3:00 Diverse and global OpenTelemetry community statistics
- 4:40 Successful large-scale end-user adoption stories
- 6:00 OpenTelemetry as standard for CNCF projects
- 7:00 Shift to baked-in telemetry for open source libraries
OpenTelemetry Project Update
Speakers: Alolita Sharma (Lead, Observability, Apple; OpenTelemetry GC Member), Daniel Gomez Blanco (New Relic; OpenTelemetry GC Member), Austin Parker (Honeycomb; OpenTelemetry GC Member), Tras Stalaker (Microsoft; OpenTelemetry GC Member), Pablo Bayans (Datadog; Core Collector Contributor; OpenTelemetry GC Member)
Conference: KubeCon EU
YouTube: https://www.youtube.com/watch?v=nclJn1KEjis
Overview
This talk provides a comprehensive update on the OpenTelemetry project, highlighting its significant growth, ongoing developments, and strategic roadmap. Presented by key members of the OpenTelemetry Governance Committee (GC), including Alolita Sharma from Apple, Daniel Gomez Blanco from New Relic, Austin Parker from Honeycomb, Tras Stalaker from Microsoft, and Pablo Bayans from Datadog, the session offers deep insights into the project's evolution as a cornerstone of cloud-native observability. It covers community milestones, advancements in core features like profiling and structured logging, the stabilization of semantic conventions, and critical updates to the OpenTelemetry Collector.
The talk underscores OpenTelemetry's increasingly pivotal role in the modern software ecosystem, moving beyond nascent adoption to large-scale, successful implementations across diverse organizations. As the second-largest project within the Cloud Native Computing Foundation (CNCF), OpenTelemetry continues to drive standardization in how applications and infrastructure emit telemetry data—traces, metrics, and logs. This update is crucial for developers, SREs, and architects seeking to understand the current state and future direction of vendor-neutral observability, ensuring their systems are instrumented effectively for performance, reliability, and security.
The presented updates are particularly significant as OpenTelemetry approaches its long-anticipated CNCF graduation. This milestone signals a mature, stable, and production-ready project, further solidifying its position as the industry standard for collecting and exporting telemetry. The new features and ongoing work discussed, from eBPF-based profiling to a dedicated structured logging API, demonstrate the project's commitment to addressing evolving observability challenges and expanding its utility across a broader range of use cases, including generative AI and client-side performance monitoring.
Background
▶ Watch: Introduction and project overview (0:00)
OpenTelemetry emerged from the convergence of two prominent CNCF projects, OpenTracing and OpenCensus, with the ambitious goal of creating a single, vendor-neutral standard for instrumenting applications to generate telemetry data. Before OpenTelemetry, the observability landscape was fragmented, often requiring developers to adopt proprietary SDKs or instrumentation libraries specific to their chosen observability backend. This led to vendor lock-in, inconsistent data formats, and significant overhead when switching tools or integrating multiple monitoring solutions.
The core problem OpenTelemetry set out to solve was this lack of standardization. By providing a unified set of APIs (Application Programming Interfaces), SDKs (Software Development Kits), and data formats (primarily OTLP - OpenTelemetry Protocol), it enables developers to instrument their code once and export telemetry data to any compatible backend. This dramatically reduces the burden of instrumentation and fosters a more open, interoperable observability ecosystem. Its initial focus encompassed distributed tracing (understanding request flow across services), metrics (numerical measurements of system health), and logging (structured events for debugging and auditing).
Initially, OpenTelemetry's approach to logging was designed to be a bridge, allowing existing logging frameworks to integrate with the OpenTelemetry SDKs to enrich logs with trace context. The project deliberately avoided creating its own user-facing logging API, acknowledging the strong and diverse opinions within the developer community regarding logging methodologies. However, as highlighted in this talk, community feedback and emerging use cases, particularly around Generative AI and client-side telemetry, prompted a re-evaluation of this strategy, leading to the development of a dedicated structured logging API.
Over its five-year journey, OpenTelemetry has grown exponentially, establishing itself as the second-largest project within the CNCF, trailing only Kubernetes. This rapid ascent underscores its critical role in enabling effective observability for cloud-native applications, which are inherently distributed, dynamic, and complex. The project's success is a testament to its strong community, its commitment to open standards, and its ability to adapt to the evolving needs of modern software development and operations.
Key Findings
▶ Watch: Diverse and global OpenTelemetry community statistics (3:00)
The talk reveals OpenTelemetry's impressive trajectory and significant advancements across community, adoption, and technical features.
Community and Growth:
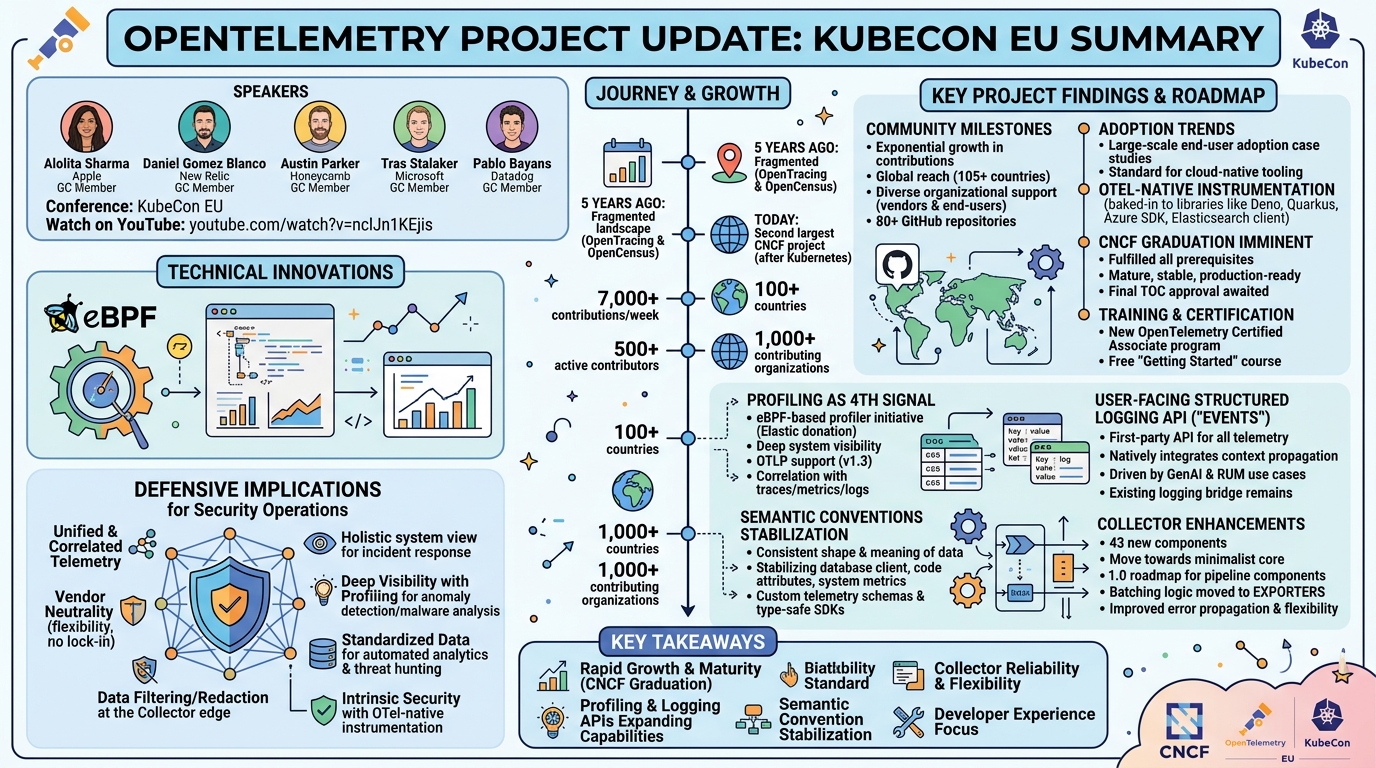
- Exponential Contribution Growth: OpenTelemetry has witnessed a phenomenal increase in contributions, from less than a thousand five years ago to over 7,000 contributions per week today.
- Active Contributor Base: More than 500 active contributors are working on the project at any given time, demonstrating a vibrant and engaged community.
- Organizational Support: Over 1,000 organizations have contributed to OpenTelemetry, with over 255 organizations actively contributing weekly. This diverse participation includes a healthy mix of vendors and end-user organizations.
- Global Reach: Contributors span over 105 countries, highlighting the project's global impact and widespread adoption.
- Project Scale: The project manages over 80 repositories on GitHub, indicating the breadth and depth of ongoing development across various SDKs, libraries, and the OpenTelemetry Collector.
End-User Adoption and Standardization:
- Large-Scale Adoption: The narrative has shifted from organizations considering OpenTelemetry to sharing successful large-scale adoption case studies at conferences like KubeCon, demonstrating tangible value in tooling consolidation and effective observability.
- Cloud-Native Standard: OpenTelemetry is being consolidated as the standard for instrumenting cloud-native tooling, with numerous CNCF projects natively integrating OpenTelemetry APIs.
- OTel-Native Instrumentation: A significant trend is the emergence of OpenTelemetry-native instrumentation directly within open-source libraries and frameworks. This means libraries are taking direct dependencies on OpenTelemetry APIs and semantic conventions, providing vendor-neutral telemetry out-of-the-box. Examples include Deno (JavaScript runtime), Quarkus (Java framework), the Azure SDK, Elasticsearch client, and MassTransit. This empowers library maintainers to define how their code is observed.
Roadmap to Graduation and Certification:
- CNCF Graduation Imminent: OpenTelemetry has fulfilled all prerequisites for CNCF graduation, including security audits and adopter interviews, and is awaiting final approval from the TOC. This is a crucial signal of maturity and reliability for enterprise adoption.
- Training and Certification: The project, in collaboration with the Linux Foundation Education, is launching an OpenTelemetry Certified Associate program (currently in beta) and offers a free "Getting Started with OpenTelemetry" course.
Major Technical Initiatives:
- Profiling as a Fourth Signal: Profiling has been officially adopted as the fourth major telemetry signal, complementing traces, metrics, and logs. OTLP has supported profiling since version 1.3. The project has accepted a system-wide profiler donated by Elastic, forming the core of an eBPF profiler initiative. Collector support is in alpha via a feature gate, with semantic conventions and specification efforts progressing towards beta this year.
- User-Facing Structured Logging API: After initially opting for a logging bridge, OpenTelemetry is now defining a user-facing structured logging API, also referred to as "events." This decision, driven by community feedback and the needs of Generative AI and client-side/Real User Monitoring (RUM) telemetry, will provide a first-party API for all telemetry signals. The existing logging bridge will remain.
- Semantic Conventions Stabilization: A top priority is stabilizing semantic conventions, which define the consistent shape and meaning of telemetry data. Database client and code annotation attributes are in release candidate, aiming for stability by the end of April, with system metrics close behind. Upcoming stabilization efforts include feature flags, Kubernetes metrics, messaging, and RPC. New work focuses on CI/CD, Generative AI, and browser/mobile semantic conventions.
- Custom Telemetry Schemas: Tools are being developed to integrate semantic conventions into the development process, allowing users to define custom telemetry schemas, generate type-safe SDKs, automatically validate telemetry, and handle schema changes, thus protecting dashboards and alerts from breaking.
- OpenTelemetry Collector Enhancements: The collector has seen significant development, with 43 new components published since the last KubeCon. 16 core libraries have been marked as 1.0. The project is moving to mark its first pipeline components as 1.x, starting with the OTLP receiver. A major revamp involves moving batching from a dedicated processor to individual exporters, offering greater flexibility and better error propagation.
Technical Deep Dive
▶ Watch: Successful large-scale end-user adoption stories (4:40)
OpenTelemetry's technical evolution is marked by strategic shifts and robust development across its core components, driven by a rapidly expanding community and diverse end-user requirements.
The project's scale is immense, managing over 80 GitHub repositories that house its various SDKs, instrumentation libraries, APIs, and the OpenTelemetry Collector. This distributed development model, supported by 500+ active contributors from 100+ countries, allows for parallel advancements across different programming languages and telemetry types. The community structure, with nine Special Interest Groups (SIGs) dedicated to various aspects, ensures focused development and consensus-building.
A significant shift highlighted in the talk is the move towards OTel-native instrumentation in open-source libraries. Traditionally, OpenTelemetry provided auto-instrumentation libraries that used techniques like monkey patching or bytecode injection to add telemetry to existing code. While effective, these methods can sometimes be fragile or introduce compatibility issues. The new paradigm encourages library owners to directly embed OpenTelemetry APIs and semantic conventions into their code. This offers several advantages:
- Maintainer Ownership: Library maintainers gain direct control over how their library is observed, ensuring the telemetry is accurate and reflects their intended usage.
- Vendor Neutrality: Users get out-of-the-box, vendor-neutral telemetry without needing external instrumentation or being locked into a specific backend.
- Unified Context: This direct integration ensures a single stream of correlated data across application code and library code, providing richer and more accurate correlation context for traces, metrics, and logs.
Examples cited include Deno, which now provides OpenTelemetry out-of-the-box as a JavaScript runtime, Quarkus as a Java framework, and client libraries like the Azure SDK and the Elasticsearch client.
The adoption of profiling as the fourth major telemetry signal is a strategic expansion of OpenTelemetry's capabilities. OTLP 1.3 already includes support for profiling data. The project has incorporated a system-wide profiler donated by Elastic, which is now central to an eBPF profiler initiative. This allows for deep, low-overhead introspection into application performance and resource utilization across the entire system. The OpenTelemetry Collector now supports profiling via a feature gate in its alpha stage, and efforts are underway to define comprehensive semantic conventions and specifications for profiling, with a goal to reach beta status this year. This will enable developers to correlate performance bottlenecks directly with traces, metrics, and logs, offering unparalleled debugging capabilities.
Perhaps one of the most notable architectural decisions discussed is the introduction of a user-facing structured logging API, often referred to as "events." The initial philosophy of OpenTelemetry was to avoid creating its own logging API, instead providing a logging bridge to connect existing logging facades with the OpenTelemetry SDK for context enrichment. However, the rise of new use cases, particularly in Generative AI and the demand for better client-side/Real User Monitoring (RUM) telemetry, demonstrated a clear need for a first-party, structured logging solution that could natively integrate with OpenTelemetry's context propagation. This new API, currently in alpha, will allow developers to emit structured logs directly through OpenTelemetry, ensuring seamless correlation with traces and metrics, and unlocking new possibilities for observability in modern, event-driven architectures and browser environments. The existing bridge will continue to be supported.
Semantic conventions remain a foundational pillar, defining the "shape" and meaning of telemetry data. The project is prioritizing their stabilization, which is critical for the entire ecosystem. Stable conventions enable libraries to implement native instrumentation reliably and allow observability backends to build consistent dashboards and alerts. Key areas nearing stabilization include database client and code annotation attributes (in release candidate), with system metrics following closely. Future efforts target feature flags, Kubernetes metrics, messaging, and RPC. A significant new direction involves tooling for custom telemetry schemas. This allows organizations to define their own semantic conventions, generate type-safe SDKs for emitting custom telemetry, automatically validate that telemetry against the schema, and manage schema changes gracefully, thereby preventing dashboards and alerts from breaking due to unexpected data formats.
The OpenTelemetry Collector, the central component for receiving, processing, and exporting telemetry, has also seen substantial enhancements. Since KubeCon Paris, 43 new components have been added, expanding its versatility. The roadmap for Collector 1.0 focuses on a more minimal distribution, with 16 core libraries already achieving 1.0 stability. A key architectural improvement is the planned transition of the OTLP receiver to 1.x status. Furthermore, a significant revamp addresses the batching mechanism. Instead of a single, dedicated batch processor, batching logic is being moved into individual exporters. This provides several benefits:
- Improved Error Propagation: Exporters can better propagate errors back up the pipeline, offering more robust error handling.
- Enhanced Flexibility: It allows for more sophisticated batching strategies tailored to specific exporter types, such as batching by megabyte size for non-OTLP formats.
- Internal Telemetry: The collector is also improving its internal telemetry, providing better visibility into the performance and behavior of its pipelines.
Finally, the project emphasizes developer experience. Surveys conducted among 500+ users and 40% of maintainers across 15+ programming languages are identifying gaps in documentation, examples, and debugging experiences. Efforts are also being made to improve the transparency and readability of decision-making and reduce dependency on synchronous meetings to accommodate the project's growing global contributor base, particularly from AMIA and Asia-Pacific regions.
Demo / Proof of Concept
▶ Watch: OpenTelemetry as standard for CNCF projects (6:00)
The talk "OpenTelemetry Project Update" was primarily a series of presentations providing comprehensive updates on the project's status, community growth, and technical roadmap, rather than a live demonstration or proof of concept of a specific feature. The speakers discussed various ongoing initiatives, upcoming features, and architectural changes, illustrating their points with slides detailing statistics, roadmaps, and conceptual diagrams. While the content covered many exciting technical developments, it did not include a hands-on live demo of any particular OpenTelemetry component or integration.
Defensive Implications
▶ Watch: Shift to baked-in telemetry for open source libraries (7:00)
The advancements and strategic direction of OpenTelemetry have profound implications for defensive security, transforming how organizations can detect, investigate, and respond to threats in cloud-native environments.
- Unified and Correlated Telemetry for Enhanced Situational Awareness:
- The core promise of OpenTelemetry – a single, vendor-neutral standard for traces, metrics, and logs – means security teams gain a holistic view of system behavior. When a security alert fires, defenders can readily correlate logs (e.g., failed login attempts, anomalous API calls) with traces (e.g., identifying the compromised service in a distributed transaction) and metrics (e.g., sudden spikes in network egress or CPU utilization). This correlation is crucial for rapidly understanding the blast radius and root cause of an incident.
- The new structured logging API directly integrates logs into this correlated stream, eliminating potential blind spots or context gaps that might arise from disparate logging solutions.
- Deep Visibility with Profiling:
- The adoption of profiling as a fourth telemetry signal, particularly with eBPF-based profilers, offers unprecedented low-level visibility into application runtime behavior. From a security perspective, this can be invaluable for:
- Detecting Anomalies: Identifying unusual resource consumption patterns (e.g., unexpected CPU spikes, memory leaks) that could indicate a denial-of-service (DoS) attack, cryptocurrency mining, or other resource exhaustion exploits.
- Malware Analysis: Analyzing the call stacks and function executions to understand the behavior of malicious code injected into an application.
- Supply Chain Security: Verifying that applications are executing as expected and not loading unauthorized libraries or functions, aiding in the detection of software supply chain attacks.
- Standardized Data for Automated Analysis and Threat Hunting:
- Semantic conventions are critical for security operations. By standardizing attribute names and values for common operations (e.g., HTTP requests, database queries, Kubernetes events), OpenTelemetry ensures consistency across diverse services and teams. This consistency enables:
- Automated Security Analytics: Easier development of security information and event management (SIEM) rules, machine learning models for anomaly detection, and automated incident response playbooks that can reliably interpret telemetry from any OpenTelemetry-instrumented service.
- Effective Threat Hunting: Security analysts can write consistent queries across their observability platforms to hunt for specific indicators of compromise (IOCs) or attack patterns, regardless of the underlying service or programming language.
- The ability to define custom telemetry schemas and generate type-safe SDKs further strengthens this. Organizations can define security-specific attributes (e.g.,
user_id,authentication_method,risk_score) and ensure they are consistently emitted and validated, protecting against data quality issues that could hinder security analysis.
- Vendor Neutrality and Reduced Lock-in:
- OpenTelemetry's vendor-neutral nature means organizations are not locked into a single security vendor's instrumentation. This allows them to:
- Choose Best-of-Breed Tools: Select the most effective security analytics platforms, threat detection systems, and incident response tools without needing to re-instrument their applications.
- Future-Proofing: Easily switch or integrate new security tools as the threat landscape evolves, without incurring significant re-instrumentation costs.
- Robust Data Collection and Processing with the Collector:
- The OpenTelemetry Collector acts as a powerful intermediary for telemetry data, offering critical security capabilities:
- Data Filtering and Redaction: Sensitive data (e.g., PII, API keys) can be filtered or redacted at the edge, before it leaves the application environment, reducing the risk of data exposure in downstream systems.
- Data Enrichment: Telemetry can be enriched with security-relevant context (e.g., adding asset tags, security classifications, or user roles) for more effective analysis.
- Load Balancing and Reliability: The collector's ability to handle high volumes of telemetry, with improvements like the new exporter-side batching, ensures that critical security logs and traces are reliably delivered, even under heavy load or during outages. This prevents gaps in security visibility.
- OTel-Native Instrumentation for Intrinsic Security:
- The trend of OpenTelemetry-native instrumentation in open-source libraries means that fundamental components of the software stack will inherently emit valuable telemetry. This reduces the reliance on external, potentially fragile auto-instrumentation, leading to more robust and reliable security data at the source. Library maintainers can ensure that critical security events within their code are exposed correctly.
In essence, OpenTelemetry empowers defenders with a comprehensive, standardized, and flexible observability framework. By providing high-quality, correlated telemetry across all signals, it significantly enhances an organization's ability to monitor, detect, analyze, and respond to security threats in complex, distributed environments. The project's ongoing maturity and adoption signal a future where robust observability is an intrinsic part of a strong security posture.
Key Takeaways
- Rapid Growth and Maturity: OpenTelemetry is a thriving project with exponential community growth, nearing CNCF graduation which signals its stability and readiness for widespread enterprise adoption.
- De Facto Observability Standard: It has become the standard for cloud-native observability, with significant end-user adoption at scale and native integration into many open-source libraries and CNCF projects, fostering a vendor-neutral ecosystem.
- New Telemetry Signals and APIs: The project is actively expanding its capabilities by adopting profiling (eBPF-based) as a fourth major signal and introducing a user-facing structured logging API ("events") to better support GenAI, RUM, and client-side telemetry.
- Semantic Conventions are Stabilizing: Critical semantic conventions for database clients, code annotation, and system metrics are nearing stability, providing essential consistency for telemetry data and enabling the definition of custom telemetry schemas for tailored observability.
- Collector Enhancements and Reliability: The OpenTelemetry Collector continues to evolve with numerous new components, a roadmap for 1.0 pipeline components (starting with the OTLP receiver), and architectural improvements like moving batching to exporters for enhanced flexibility and error handling.
- Focus on Developer Experience: The project prioritizes developer experience, actively gathering feedback through surveys to improve documentation, debugging, and overall usability, while also adapting to its global contributor base with more asynchronous working models.
About the Speaker(s)
The "OpenTelemetry Project Update" talk was delivered by a distinguished panel of leaders and core contributors from the OpenTelemetry Governance Committee (GC), representing various prominent technology companies:
- Alolita Sharma: Leads observability at Apple and is a long-term OpenTelemetry contributor and maintainer. As a GC member, she provided the opening remarks and guided the overall presentation.
- Daniel Gomez Blanco: A GC member representing New Relic, he presented insights into OpenTelemetry's end-user adoption and the growing trend of OTel-native instrumentation in open-source libraries.
- Austin Parker: A GC member from Honeycomb, he covered critical project updates, including the imminent CNCF graduation, new training programs, and major initiatives like profiling and the new structured logging API.
- Tras Stalaker: A GC member from Microsoft, he provided a detailed overview of the semantic conventions, highlighting stabilization efforts and new work streams around CI/CD, Generative AI, and browser/mobile telemetry.
- Pablo Bayans: A core collector contributor and GC member from Datadog, he presented updates on the OpenTelemetry Collector, including new components, the 1.0 roadmap, and architectural improvements to batching and internal telemetry, as well as insights from developer experience surveys.
Reviews
Dr. Zero (Offensive Security Researcher) — MUST SEE
This talk delivers a critical, high-signal update on OpenTelemetry, a foundational project for cloud-native observability. Presented by the project's Governance Committee, it details exponential community growth, imminent CNCF graduation, and significant technical advancements including the adoption of profiling as a fourth telemetry signal, a new user-facing structured logging API, and crucial semantic convention stabilization. The session provides invaluable insights into the project's future, offering actionable intelligence for anyone building, operating, or securing modern distributed systems, marking it as essential viewing for understanding the evolving landscape of vendor-neutral…
Heather Calloway (CISO) — STRONG ACCEPT
This OpenTelemetry project update is a critical briefing for any CISO or security leader navigating cloud-native environments. It outlines the strategic evolution of observability, emphasizing standardization, vendor neutrality, and expanded telemetry signals like profiling and structured logging. While not a direct security solution, OpenTelemetry is foundational to building resilient, accountable systems and significantly enhances our ability to detect, investigate, and respond to threats by providing consistent, correlated data across the enterprise. Its maturity and widespread adoption make it an essential component of modern security programs.