Jaeger V2: OpenTelemetry at the Core of Modern Distributed Tracing - Jonah Kowall, Paessler
Jonah Kowall, Paessler
KubeCon + CloudNativeCon Europe 2025 · Session
Overview
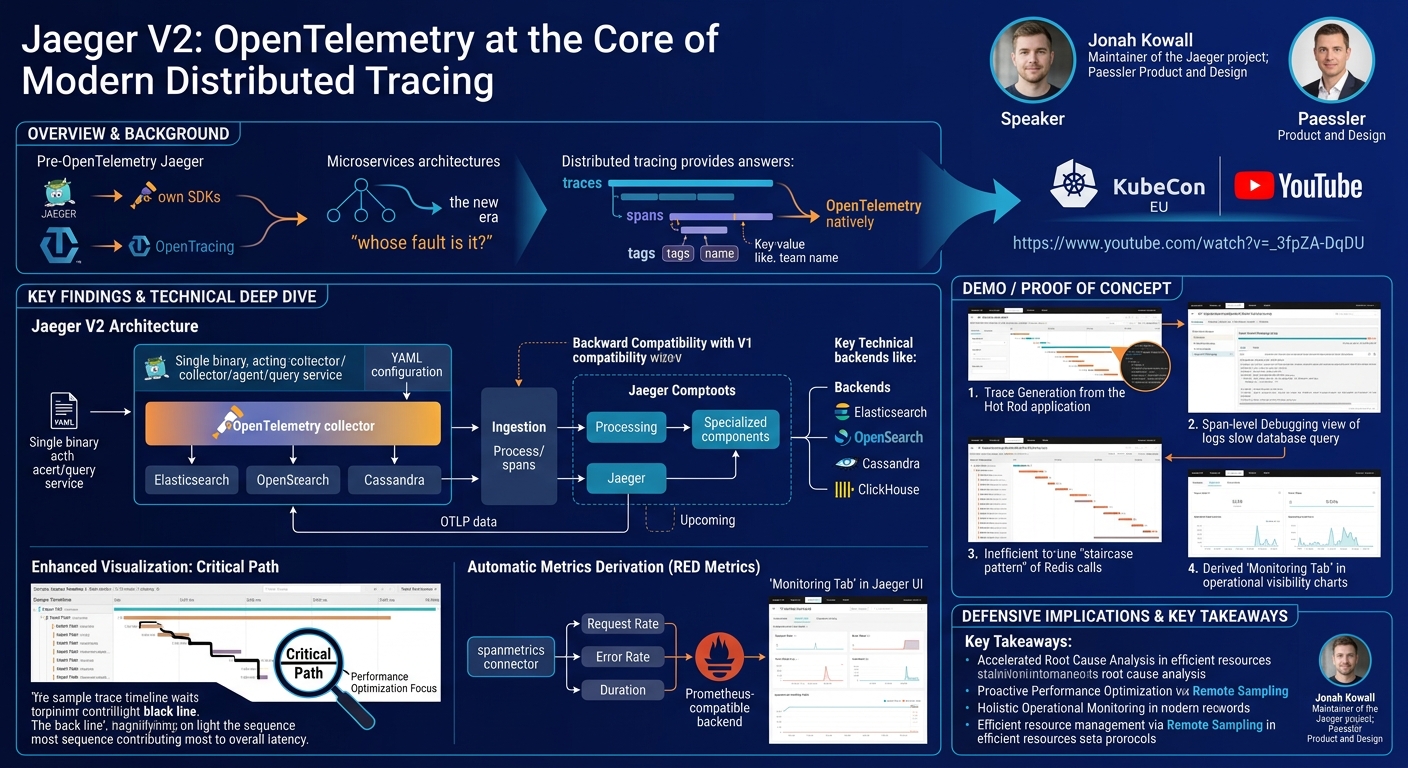
Jonah Kowall, a maintainer of the Jaeger project, delivered an insightful talk at KubeCon EU, unveiling Jaeger version 2 – a monumental multi-year effort to re-platform the distributed tracing system entirely on OpenTelemetry. This talk delves into the critical role of distributed tracing in modern microservices architectures, addressing the pervasive challenge of identifying root causes and ownership in complex, distributed systems. Kowall meticulously outlines how Jaeger V2 leverages OpenTelemetry's robust collection and processing capabilities to offer enhanced performance, streamlined configuration, and powerful new features like critical path analysis and automatic derivation of operational metrics.
Key moments
- 0:00 Introduction and Jaeger V2 announcement
- 2:00 Explaining the importance of distributed tracing
- 3:20 Understanding core concepts: traces, spans, and tags
- 4:40 Starting live demo with Hot Rod application
- 6:00 Demonstrating the critical path for performance optimization
- 6:55 Debugging a slow database query with logs
- 7:40 Identifying and optimizing inefficient Redis calls (staircase pattern)
Jaeger V2: OpenTelemetry at the Core of Modern Distributed Tracing
Speakers: Jonah Kowall, Maintainer of the Jaeger project; Paessler (Product and Design)
Conference: KubeCon EU
YouTube: https://www.youtube.com/watch?v=_3fpZA-DqDU
Overview
Jonah Kowall, a maintainer of the Jaeger project, delivered an insightful talk at KubeCon EU, unveiling Jaeger version 2 – a monumental multi-year effort to re-platform the distributed tracing system entirely on OpenTelemetry. This talk delves into the critical role of distributed tracing in modern microservices architectures, addressing the pervasive challenge of identifying root causes and ownership in complex, distributed systems. Kowall meticulously outlines how Jaeger V2 leverages OpenTelemetry's robust collection and processing capabilities to offer enhanced performance, streamlined configuration, and powerful new features like critical path analysis and automatic derivation of operational metrics.
The presentation highlights Jaeger V2's commitment to backward compatibility while introducing significant architectural shifts, including a single binary design and YAML-based configuration, aligning closely with the OpenTelemetry collector's philosophy. For organizations grappling with the complexities of cloud-native environments, Jaeger V2 promises to simplify observability, providing deep insights into application behavior, performance bottlenecks, and error rates. By integrating directly with OpenTelemetry, Jaeger V2 not only future-proofs tracing infrastructure but also empowers developers and operations teams with a more unified and efficient approach to monitoring and debugging.
This evolution of Jaeger is particularly significant as it solidifies the project's position within the broader OpenTelemetry ecosystem, benefiting from community contributions and standardized data formats. The talk emphasizes the practical benefits for users, from accelerating root cause analysis and optimizing application performance to enabling proactive operational monitoring through automatically generated metrics. It underscores the project's ongoing dedication to improving user experience, expanding storage options, and fostering community involvement through initiatives like mentorship programs.
Background
▶ Watch: Introduction and Jaeger V2 announcement (0:00)
The proliferation of microservices architectures has revolutionized software development, enabling greater agility, scalability, and independent deployment cycles. However, this paradigm shift introduces significant challenges in understanding the end-to-end flow of requests and pinpointing the source of issues. In a distributed environment where dozens or even hundreds of services interact, the question "whose fault is it?" often devolves into finger-pointing. Distributed tracing emerges as the indispensable solution to answer more precise questions: "where did it break?", "why did it break?", and "who can fix it?".
Jaeger, originally developed by Uber, was conceived to tackle these very problems. It provides a comprehensive system for collecting, storing, and visualizing traces—the end-to-end transactions that span multiple services. Each trace is composed of multiple spans, which represent individual operations or components within the transaction. Crucially, spans contain tags, key-value pairs that offer rich metadata, allowing users to add custom information for filtering, categorization (e.g., by team name), and deeper analysis. This foundational data model enables powerful capabilities like building dependency maps, performing root cause analysis, and deriving crucial metrics for monitoring Service Level Agreements (SLAs), availability, and error rates.
Before the advent of OpenTelemetry, Jaeger relied on its own SDKs and the OpenTracing standard for instrumentation. When OpenTelemetry began, it adopted many concepts from the Jaeger collector, eventually becoming the vendor-neutral standard for observability data collection. The challenge for Jaeger, and many other tracing systems, was to align with this evolving standard without disrupting existing deployments. This historical context sets the stage for Jaeger V2, which represents a complete re-platforming effort to embrace OpenTelemetry natively, moving away from legacy instrumentation and processing components to a unified, community-driven approach.
Key Findings
▶ Watch: Understanding core concepts: traces, spans, and tags (3:20)
The release of Jaeger version 2 represents a significant milestone, marking a complete re-platforming of the distributed tracing system to be OpenTelemetry-native. This strategic shift brings several key findings and advancements:
- Full OpenTelemetry Alignment: Jaeger V2 is now built directly on the OpenTelemetry collector architecture, leveraging its processing pipelines and robust capabilities. This means the Jaeger project has entirely moved its backend and processing on top of OpenTelemetry, effectively retiring its legacy instrumentation and collector components.
- Simplified Deployment and Configuration: The new version introduces a single binary that can act in various roles (collector, agent, query service) and adopts YAML-based configuration, aligning with the OpenTelemetry collector's familiar approach. This significantly streamlines deployment and management compared to Jaeger V1's command-line interface with numerous parameters.
- Backward Compatibility: Despite the architectural overhaul, Jaeger V2 maintains full backward compatibility with Jaeger V1. Existing data repositories and data formats remain unchanged, ensuring a seamless upgrade path for current users without requiring data migration or re-instrumentation (provided they have already moved to OpenTelemetry SDKs).
- Native OTLP Support: With OpenTelemetry at its core, Jaeger V2 offers native support for the OpenTelemetry Protocol (OTLP), simplifying data ingestion from OpenTelemetry-instrumented applications.
- Enhanced Visualization: Critical Path: A notable UI improvement is the critical path visualization. This feature identifies the longest, contention-ridden segments of a trace, marked by a "black line," guiding users to the most impactful areas for performance optimization. Optimizing components not on the critical path will not yield significant speed improvements.
- Automatic Metrics Derivation (RED Metrics): Jaeger V2, through the spanmetrics connector in OpenTelemetry, can automatically derive RED metrics (Request Rate, Error Rate, Duration) directly from trace data. This provides essential operational visibility and monitoring capabilities without the need for separate metric instrumentation, addressing common challenges in correlating service mesh data. These metrics can be exported to any Prometheus-compatible backend.
- Remote Sampling: Jaeger V2 retains and enhances remote sampling, a unique feature allowing dynamic adjustment of head-based sampling rates in application SDKs without requiring restarts or code changes. This offers fine-grained control over tracing overhead.
- New Storage Backends and UI Modernization: The project is actively working on adding ClickHouse as an officially supported backend (80% complete) and undertaking a significant UI modernization effort. This includes refactoring visualization libraries for consistency and introducing data overlay capabilities, allowing metrics to be viewed directly on trace graphs.
- Community-Driven Development: Jaeger heavily relies on mentorship programs (Linux Foundation, Google Summer of Code, CNCF) to engage students and new contributors, significantly accelerating development on features like the Helm chart, Kubernetes operator, and Jaeger V2 itself.
Technical Deep Dive
▶ Watch: Starting live demo with Hot Rod application (4:40)
Jaeger V2's technical foundation is deeply intertwined with OpenTelemetry, representing a strategic pivot towards a unified observability standard. At its heart, Jaeger V2 is essentially an OpenTelemetry collector with specialized components and extensions that provide Jaeger's distinctive features.
The fundamental building blocks of tracing remain traces, spans, and tags. A trace represents a complete transaction journey across multiple services. Spans are individual operations within that journey, capturing execution time, service names, and relationships (parent-child). Tags are arbitrary key-value pairs attached to spans, crucial for adding context, filtering, and custom metadata. For instance, a custom tag like team_name: "billing" allows easy isolation of traces from specific development teams.
One of the most powerful analytical features in Jaeger V2 is the critical path visualization. This algorithm identifies the sequence of operations within a trace that contributes the most to its overall latency. Visually represented by a "black line" in the trace timeline, it highlights areas of contention or sequential execution that, if optimized, would yield the most significant performance improvements. This is a crucial diagnostic tool, as optimizing operations not on the critical path will have little to no impact on the overall transaction duration. For example, if a database query is on the critical path and takes 500ms, reducing another parallel operation from 100ms to 50ms will not speed up the overall transaction, but optimizing the database query will.
A significant technical contribution is the automatic derivation of RED metrics (Request Rate, Error Rate, Duration) directly from trace data. This addresses a common challenge in microservices: gaining operational visibility without redundant instrumentation. The mechanism involves the spanmetrics connector, an OpenTelemetry component. As traces flow through the OpenTelemetry collector pipeline, the spanmetrics processor extracts relevant data from spans (e.g., service name, operation name, status code, duration). It then aggregates this information into time-series metrics, which are subsequently exported to a Prometheus-compatible backend. This process is configured within the OpenTelemetry collector's YAML, where spanmetrics is specified as an exporter in the trace pipeline, feeding into a separate metrics pipeline. This elegant solution ensures that operational metrics are a natural byproduct of tracing, providing a unified view of service health and performance.
The architecture of Jaeger V2 itself is a testament to its OpenTelemetry integration. It is deployed as a single binary that encapsulates all core Jaeger functionalities: data collection, processing, storage interaction, and the UI. This binary can be configured via a YAML file to assume different roles, mirroring the flexibility of the OpenTelemetry collector. For instance, it can act as a collector receiving OTLP data, an agent running alongside applications, or a query service. Jaeger V2 also leverages OpenTelemetry's extension capability, with the Jaeger UI itself running as an OpenTelemetry extension, a novel approach that demonstrates the collector's extensibility.
For data persistence, Jaeger V2 implements its storage API directly within the OpenTelemetry collector. It officially supports Elasticsearch (version 8 and newer), OpenSearch, and Cassandra. The roadmap indicates the imminent addition of ClickHouse as another officially supported backend, further expanding storage options for diverse operational needs.
Deployment patterns vary based on scale:
- Simple Architecture: For development or smaller environments, applications instrumented with OpenTelemetry send traces directly to a Jaeger V2 instance acting as a collector. This collector writes data to the chosen database (Elasticsearch, OpenSearch, Cassandra), and the Jaeger UI queries this database for visualization.
- Scaled Architecture: For high-throughput production environments, Kafka is introduced as an intermediary buffer. Applications send traces to a Jaeger V2 collector, which then publishes them to a Kafka queue. Another Jaeger V2 instance (or group of instances) consumes from Kafka and writes the data to the persistent storage. This pattern prevents overwhelming the database during traffic spikes and ensures data durability. Jaeger V2's binary includes built-in Kafka support for both ingress and egress.
Finally, remote sampling is a sophisticated feature unique to Jaeger, inherited from its Uber origins. It allows OpenTelemetry SDKs (in supported languages) to dynamically query the Jaeger collector for sampling configuration. This enables operators to adjust sampling rates (e.g., to trace 10% of requests for a specific service) on the fly without redeploying or restarting the application. This granular control is vital for balancing observability needs with the overhead of trace data collection.
Demo / Proof of Concept
▶ Watch: Debugging a slow database query with logs (6:55)
Jonah Kowall presented multiple live demonstrations to illustrate Jaeger's capabilities, both in its traditional tracing role and its new monitoring features. The primary application used for the demos was Hot Rod, a mini-Uber emulation designed to generate distributed traces across several microservices.
The first demo focused on the core tracing functionality:
- Trace Generation: By interacting with the Hot Rod application (e.g., dispatching cars), a stream of distributed traces was generated, hitting various microservices.
- Jaeger UI - Trace Timeline: The Jaeger UI displayed a timeline of all recent traces. Kowall demonstrated filtering capabilities, such as searching by time range, duration, or specific tags. He highlighted the utility of custom tags, like a
team_nametag, for easily isolating traces from different development teams. - Detailed Trace View: Selecting an individual trace revealed the familiar cascading timeline view of its constituent spans. Here, the critical path was prominently displayed as a "black line," indicating the most time-consuming sequence of operations. Kowall emphasized that optimization efforts should focus exclusively on these critical path elements.
- Span-level Debugging: Drilling into a specific span, such as a slow database query, revealed detailed metadata including its type (e.g., MySQL), the application language (Go), and associated OpenTelemetry data. Crucially, the demo showed how logs gathered by instrumentation were directly associated with the span, illustrating a database lock event and its release. This demonstrated Jaeger's power for deep root cause analysis.
- Performance Optimization Insight: Kowall pointed out a "staircase pattern" of repeated Redis calls within a trace. This pattern indicated a lack of threading, with each Redis call waiting for the previous one to complete. He explained that by introducing threading, these calls could be parallelized, significantly speeding up the transaction and shifting the critical path.
- Alternative Visualizations: Beyond the timeline, Jaeger offers other views like a flame graph and a graph view for different perspectives on trace topology.
- Raw Data Export/Import: A practical feature shown was the ability to view the raw JSON data for any trace. More uniquely, users can upload a JSON file containing trace data directly into Jaeger. This is useful for offline debugging or sharing trace data with colleagues who may not have direct access to a Jaeger instance.
The second demo showcased Jaeger V2's new monitoring capabilities:
- Derived Metrics Setup: While the Hot Rod application continued to generate traces in the background, Kowall explained how Jaeger V2, through the spanmetrics connector in OpenTelemetry, automatically derives RED metrics (Request Rate, Error Rate, Duration) from these traces. These metrics were being sent to a local Prometheus instance running alongside Jaeger.
- Monitoring Tab: The Jaeger UI's new "Monitoring" tab was demonstrated, querying the Prometheus instance to visualize these derived metrics. For a simple application, this showed a clear operational overview. In a more complex production environment, this tab would list various applications, allowing filtering and different visualizations of their RED metrics. This demonstrated how Jaeger bridges the gap between deep trace analysis and high-level operational monitoring.
- Topology View (Acknowledged Limitation): Kowall briefly mentioned the topology view, which visualizes transaction flows and volumes between components. He noted that this currently requires running a Spark job for aggregation, acknowledging it as a somewhat "annoying" step but also indicating future plans to make this dynamic using OpenSearch.
These demos effectively illustrated Jaeger V2's comprehensive capabilities, from pinpointing micro-level performance issues and debugging specific transactions to providing macro-level operational insights through automatically derived metrics, all within a unified OpenTelemetry-native framework.
Defensive Implications
▶ Watch: Identifying and optimizing inefficient Redis calls (staircase pattern) (7:40)
The advancements in Jaeger V2, particularly its tight integration with OpenTelemetry and new analytical capabilities, offer significant defensive implications for organizations operating microservices architectures:
- Accelerated Root Cause Analysis: The ability to trace end-to-end transactions, coupled with detailed span information, tags, and integrated logs, empowers defenders to rapidly identify the precise service, component, or even line of code responsible for an incident. This reduces mean time to resolution (MTTR) by eliminating guesswork and "finger-pointing" across teams.
- Proactive Performance Optimization: The critical path visualization is a game-changer for performance engineering. By clearly highlighting bottlenecks, defenders can focus their efforts on the most impactful areas for optimization, preventing performance degradation from impacting user experience or service level agreements (SLAs). This shifts performance tuning from reactive firefighting to proactive, data-driven improvement.
- Holistic Operational Monitoring: The automatic derivation of RED metrics (Request Rate, Error Rate, Duration) directly from trace data provides essential operational visibility. Defenders can monitor these key indicators for all instrumented services without separate metric instrumentation, enabling early detection of anomalies, error spikes, or latency increases. This ensures that services are meeting their SLAs and provides a consistent understanding of service health.
- Enhanced Observability for Service Meshes: For environments utilizing service meshes, where traditional tracing correlation can be challenging, the derived metrics provide a robust fallback for operational monitoring. This ensures that even if full end-to-end traces are incomplete, essential health metrics are still available for every service.
- Efficient Resource Management with Dynamic Sampling: Remote sampling allows defenders to dynamically adjust the volume of trace data collected. In high-volume environments, this is crucial for managing the overhead of tracing without sacrificing visibility. During an incident, sampling can be temporarily increased for deeper investigation, and then reduced once the issue is resolved, optimizing storage and processing costs.
- Standardization and Future-Proofing: By fully embracing OpenTelemetry, Jaeger V2 provides a standardized approach to observability. This means defenders are not locked into proprietary formats or vendors, fostering interoperability with other OpenTelemetry-compatible tools and ensuring that their observability infrastructure can evolve with community standards.
- Improved Collaboration and Debugging: Features like raw JSON export/import facilitate offline debugging and sharing of trace data among team members, even those without direct access to the Jaeger instance. This streamlines collaboration during incident response and development cycles.
- Robust Data Ingestion: For large-scale deployments, the integrated Kafka support in Jaeger V2 ensures resilient data ingestion. It acts as a buffer against traffic spikes, preventing data loss and protecting the backend storage systems from overload, thereby maintaining the integrity and availability of observability data.
In essence, Jaeger V2 provides defenders with a powerful, integrated, and standardized toolkit to not only diagnose and resolve issues more efficiently but also to proactively identify and address performance bottlenecks, ensuring the reliability and optimal performance of their distributed applications.
Key Takeaways
- OpenTelemetry Native: Jaeger V2 is completely re-platformed on the OpenTelemetry collector, offering a single binary for all components and YAML-based configuration, aligning with modern cloud-native practices.
- Critical Path Visualization: A powerful UI feature that highlights the most time-consuming segments of a trace, enabling focused and effective performance optimization efforts.
- Automatic RED Metrics: Jaeger V2 automatically derives Request Rate, Error Rate, and Duration metrics from trace data using the OpenTelemetry
spanmetricsconnector, providing essential operational monitoring without separate instrumentation. - Dynamic Remote Sampling: Offers unique control over tracing overhead by allowing dynamic adjustment of head-based sampling rates in application SDKs without requiring application restarts.
- Continuous Improvement & Community: The project is actively enhancing the UI, expanding storage options (e.g., ClickHouse support), and leveraging mentorship programs to foster community contributions and accelerate development.
- Backward Compatibility: Despite the significant architectural overhaul, Jaeger V2 maintains full backward compatibility with Jaeger V1 data formats and repositories, ensuring a smooth transition for existing users.
About the Speaker(s)
Jonah Kowall is a prominent figure in the open-source observability community and a key maintainer of the Jaeger project. Beyond his significant contributions to Jaeger, Jonah's day job involves running product and design at Paessler, a company known for its infrastructure monitoring product, PRTG. He is also actively involved in the OpenSearch ecosystem, serving on its technical steering committee. In his personal time, Jonah is an avid diver, frequently exploring underwater environments globally from his home in South Florida. His diverse experience across product leadership, open-source maintenance, and technical steering committees underscores his deep expertise in distributed systems, monitoring, and observability.
Reviews
Dr. Zero (Offensive Security Researcher) — MUST SEE
Dr. Viktor "Zero" Kozlov assesses Jaeger V2 as a pivotal advancement in distributed tracing, showcasing a multi-year, technically profound re-platforming onto OpenTelemetry. This isn't just an update; it's a strategic overhaul delivering critical path analysis, automatic RED metrics from trace data, and streamlined deployment. The speaker, a Jaeger maintainer, demonstrates deep technical ownership and provides actionable insights for anyone grappling with microservices observability. This sets a new standard for how we leverage tracing for proactive defense and performance optimization.
Heather Calloway (CISO) — STRONG ACCEPT
This presentation on Jaeger V2's re-platforming on OpenTelemetry is a strong example of how foundational technical work directly informs operational resilience and accountability. The advancements in critical path visualization, automatic RED metrics derivation, and streamlined deployment provide security leaders and operators with essential tools to accelerate root cause analysis, proactively optimize performance, and maintain service level agreements in complex microservices environments. While a technical deep dive, its implications for reducing MTTR and clarifying ownership make it highly relevant for executive-level understanding of system health and risk management.