First Day Foresight: Anomaly Detection for Observability - Prashant Gupta & Kruthika Prasanna Simha
Prashant Gupta, Kruthika Prasanna Simha
KubeCon + CloudNativeCon Europe 2025 · Session
Overview
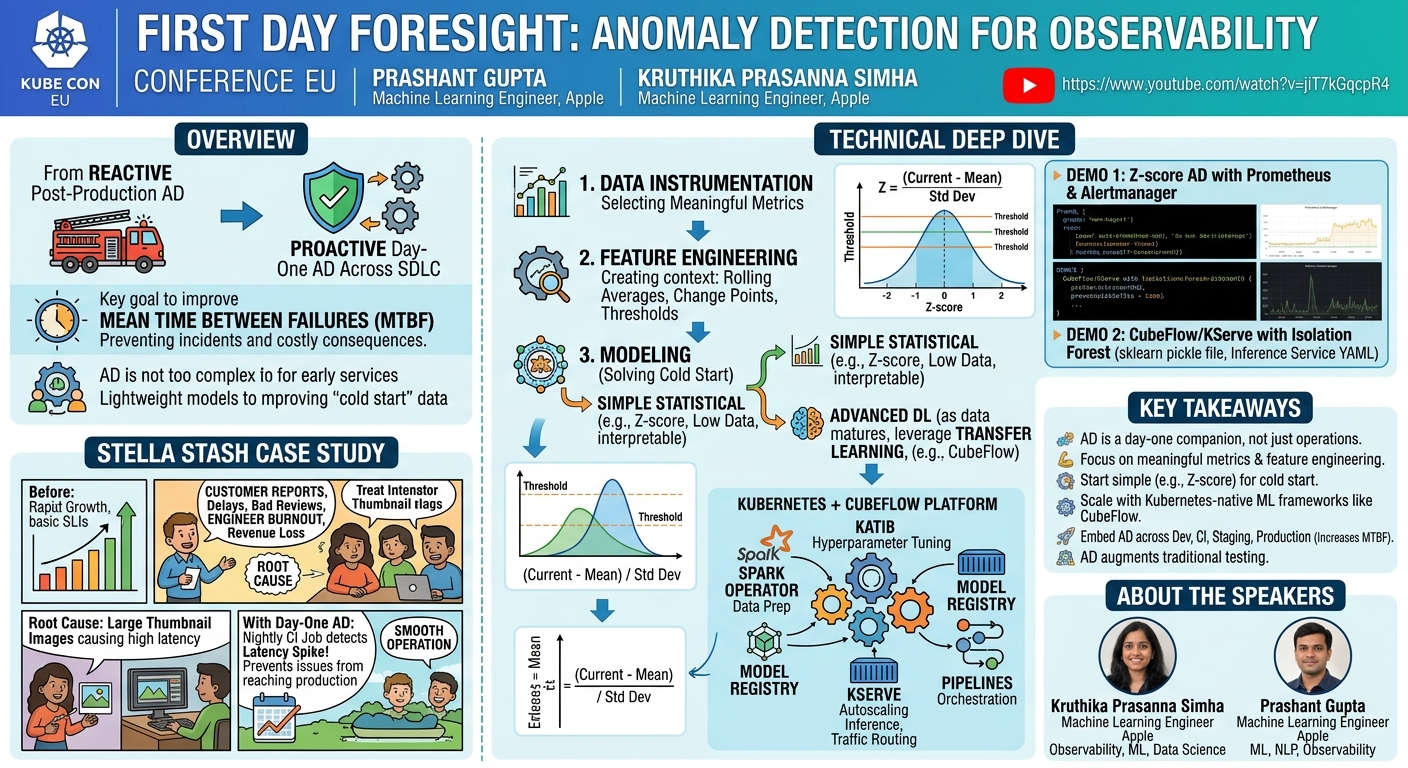
In the fast-paced world of cloud-native development, ensuring the reliability and performance of services from their inception is paramount. This talk, "First Day Foresight: Anomaly Detection for Observability," presented by Prashant Gupta and Kruthika Prasanna Simha from Apple, addresses a critical paradigm shift: moving anomaly detection from a reactive, post-production activity to a proactive, day-one development practice. The speakers argue that by embedding anomaly detection throughout the entire software development lifecycle (SDLC), organizations can significantly improve the mean time between failures (MTBF), preventing incidents before they impact users and lead to costly consequences.
Key moments
- 0:40 Shifting from reactive to proactive observability with AD
- 1:55 Key takeaways: Why Day One Anomaly Detection matters
- 2:40 Case study: Introducing Stella Stash, an astronomy store
- 4:30 Consequences of not having Day One Anomaly Detection
- 5:00 Debunking common assumptions about anomaly detection
- 7:00 The ML lifecycle for Day One Anomaly Detection
- 7:40 Importance of meaningful metrics in anomaly detection
First Day Foresight: Anomaly Detection for Observability
Speakers: Prashant Gupta, Machine Learning Engineer, Apple; Kruthika Prasanna Simha, Machine Learning Engineer, Apple
Conference: KubeCon EU
YouTube: https://www.youtube.com/watch?v=jiT7kGqcpR4
Overview
In the fast-paced world of cloud-native development, ensuring the reliability and performance of services from their inception is paramount. This talk, "First Day Foresight: Anomaly Detection for Observability," presented by Prashant Gupta and Kruthika Prasanna Simha from Apple, addresses a critical paradigm shift: moving anomaly detection from a reactive, post-production activity to a proactive, day-one development practice. The speakers argue that by embedding anomaly detection throughout the entire software development lifecycle (SDLC), organizations can significantly improve the mean time between failures (MTBF), preventing incidents before they impact users and lead to costly consequences.
The core premise of the presentation challenges conventional wisdom that anomaly detection is too complex or only relevant for mature, production-ready services. Instead, Gupta and Simha demonstrate how even nascent services can benefit from lightweight anomaly detection models and frameworks, overcoming the notorious "cold start problem" of limited historical data. They illustrate practical approaches, from simple statistical methods leveraging existing observability tools like Prometheus to advanced deep learning pipelines orchestrated by Kubernetes-native platforms like CubeFlow, making sophisticated anomaly detection accessible and scalable for modern development teams.
This shift from reactive incident response to proactive failure prevention holds immense value for developers, operations teams, and ultimately, user experience and business continuity. By catching performance regressions, integration bugs, and environmental drifts early in development, CI/CD, and staging environments, teams can reduce engineer burnout, maintain user loyalty, and safeguard revenue, fundamentally improving the resilience and reliability of cloud-native applications from day one.
Background
▶ Watch: Shifting from reactive to proactive observability with AD (0:40)
The speakers began by referencing their previous KubeCon talk, which focused on how anomaly detection could reduce the Mean Time To Detect (MTTD) and Mean Time To Resolve (MTTR) incidents. This current presentation builds upon that foundation, aiming to take it a step further by improving the Mean Time Between Failures (MTBF), thereby preventing failures from occurring in the first place. The overarching goal is to transform the approach to observability from being reactive to proactive, ensuring services are robust and reliable from their initial deployment.
The problem statement is illustrated through a compelling case study of a fictional startup, "Stella Stash," an astronomy-themed online store. Initially, Stella Stash focused on rapid expansion, instrumenting basic Service Level Indicators (SLIs) like request latency, QPS (Queries Per Second), and failure rate, alongside low-level infrastructure metrics. However, they lacked any proactive alerting or anomaly detection mechanisms. As the service grew and new features, such as online tutorials, were added, customers began reporting delays, higher latencies, and timeouts. Without early warning systems, these issues escalated into a wave of one-star reviews, leading to a poor user experience, loss of user loyalty, engineer burnout from frantic root cause analysis, and ultimately, loss of revenue as users migrated to competitors. The root cause was eventually identified: excessively large thumbnail images in the tutorial catalog, which significantly increased page load times as more courses were added.
This case study highlights two common, yet flawed, assumptions in service development. The first is that anomaly detection is only useful for mature, production-ready services. Developers often perceive early-stage services as too chaotic and unpredictable for anomaly detection to be effective, seeing it as an unnecessary overhead. The second assumption is that anomaly detection is inherently complex, requiring significant engineering cycles that could otherwise be spent delivering features. The speakers vehemently challenge these notions, arguing that early-stage services are precisely when anomaly detection is most critical, and that modern tools and lightweight models make it far less complex than commonly believed. Had Stella Stash implemented day-one anomaly detection, a nightly CI job could have flagged the latency spike caused by the large thumbnails, preventing the issue from ever reaching production and impacting users.
Key Findings
▶ Watch: Case study: Introducing Stella Stash, an astronomy store (2:40)
The talk presents several key findings that underpin the philosophy of day-one anomaly detection and its implementation:
- Anomaly detection is a day-one decision, not just a post-production tool. This is the central thesis, advocating for integrating anomaly detection early in the development lifecycle to prevent issues rather than merely reacting to them.
- Great anomaly detection starts with great observability and meaningful metrics. Simply collecting more metrics can lead to alert fatigue and chaos. The focus should be on identifying and instrumenting metrics that truly reflect service health and user experience. Feature engineering is highlighted as the "first model," enriching raw metrics with context (e.g., rolling averages, change point indicators) to provide deeper insights.
- Models must align with operational reality. The choice of anomaly detection model should strike a balance between accuracy, latency, and interpretability. For early-stage services, simpler, more interpretable models are often preferred, evolving to more complex models as data patterns mature and trust in the system grows.
- The immense value of applying anomaly detection across the entire SDLC. Beyond production, anomaly detection can be invaluable in development, CI/CD, and staging environments to catch flaky behavior, performance regressions, and integration bugs before they ever reach end-users.
- Overcoming the "cold start problem" is crucial for early adoption. The lack of historical data, baselines, temporal patterns, distributional context, and labeled anomalies in nascent services can be addressed through simple statistical models, leveraging prior domain knowledge, and generating synthetic data.
- Kubernetes-native ML frameworks like CubeFlow simplify the operationalization of complex models. As services scale and data patterns become more intricate, CubeFlow provides the necessary tools for distributed data preparation, training, model serving, and automated pipelines, abstracting away much of the infrastructure complexity.
Technical Deep Dive
▶ Watch: Consequences of not having Day One Anomaly Detection (4:30)
Implementing day-one anomaly detection follows a typical machine learning lifecycle, adapted for early-stage services: data instrumentation, feature engineering, modeling, and deployment/inference.
The first step, data instrumentation, emphasizes the importance of selecting meaningful metrics. Rather than indiscriminately collecting every possible metric, teams should focus on those that directly indicate service health, performance, and user experience. This selective approach helps avoid "alert fatigue" and unnecessary operational overhead.
Next, feature engineering plays a pivotal role in enriching raw metric data. Instead of relying solely on raw values, engineers can create derived features that provide better context for anomaly detection models. Examples include rolling averages, which smooth out noise and highlight trends; change point drift indicators, which detect shifts in behavior; and domain-specific thresholds, which encode expert knowledge about acceptable operating ranges. These engineered features transform raw data into actionable insights, making it easier to identify subtle deviations.
The challenge of modeling in early-stage services is primarily the cold start problem, characterized by limited or no historical data, lack of baselines, absence of temporal patterns, insufficient distributional context, and no labeled anomalies. To address this, the speakers propose three strategies:
- Start Simple: Utilize lightweight statistical anomaly detection models that do not require extensive historical data or complex deep learning pipelines. The Z-score is highlighted as an excellent example. It effectively identifies sudden spikes or deviations in normally distributed data, requiring only a running mean and standard deviation. Its advantages include real-time detection, minimal configuration, low operational cost, and high interpretability, making it an ideal first line of defense.
- Use Prior Knowledge/Domain Expertise: Even without historical data, domain experts possess invaluable knowledge about what constitutes "normal" behavior or critical thresholds (e.g., expected request latency, critical CPU utilization). This knowledge can be encoded into models, used to smooth noisy metrics, or tune model parameters, providing essential context to statistical models.
- Leverage Synthetic Data: By simulating real-world behavior, stress-testing services, and injecting controlled anomalies (e.g., metric spikes, resource exhaustion, error injection), synthetic data can bootstrap the cold start problem. It provides labeled anomalies for model training, improves model feedback, and helps validate the chosen features and models in a safe, isolated environment.
As services mature and data patterns become more complex, the need for advanced models, particularly deep learning, emerges. While powerful, deep learning models introduce their own set of challenges:
- Application-side: Lack of labeled data (anomalies are rare), risk of overfitting, difficulty in generalizing across use cases, and challenges in model interpretation (often considered "black box").
- Infrastructure-side: Resource-intensive training jobs, scaling difficulties across environments, complexity of managing diverse environments (training, testing, production), and the need for reliable, continuous deployment.
To mitigate these, the talk suggests:
- Transfer Learning: Reusing pre-trained models (e.g., from Hugging Face) that have been trained on large, diverse public datasets. These models can then be fine-tuned on smaller, domain-specific datasets, accelerating development even with limited local data.
- Kubernetes and CubeFlow: Kubernetes provides the foundational infrastructure for containerization and orchestration. CubeFlow is then introduced as an open-source, purpose-built platform for operationalizing machine learning on Kubernetes, making ML simple, portable, and scalable. Key CubeFlow components include:
- Spark Operator: For distributed data preparation and feature engineering at scale, including transformations like PCA (Principal Component Analysis) or time windowing.
- CubeFlow Trainer: For training large-scale, distributed ML jobs, supporting transfer learning and leveraging tools like Katib for hyperparameter tuning.
- Model Registry: A centralized, versioned data store for ML metadata and model artifacts.
- KServe: An essential component for inference and model serving at scale, offering autoscaling, traffic routing, and service exposure capabilities.
- CubeFlow Pipelines: For orchestrating containerized deployments, progressive rollouts, and automating the entire ML workflow.
This integrated approach allows teams to leverage the power of deep learning without getting bogged down by infrastructure complexities, enabling a scalable anomaly detection pipeline from data preparation to production.
Demo / Proof of Concept
▶ Watch: The ML lifecycle for Day One Anomaly Detection (7:00)
The talk included two demonstrations to illustrate the implementation of day-one anomaly detection, starting with a basic statistical approach and then moving to a more sophisticated CubeFlow deployment.
The first demo showcased Z-score anomaly detection using Prometheus and PromQL. The speakers demonstrated how to:
- Identify a key metric indicative of service health.
- Calculate the running mean and running standard deviation of this metric over a specified time window (e.g., 5 minutes) using PromQL functions.
- Apply the Z-score formula:
(current_metric_value - running_mean) / running_standard_deviation. - Set an alerting threshold, typically 2 to 3 standard deviations, to identify anomalous data points. For the demo, anything beyond 2 standard deviations was considered anomalous.
- Configure a simple Prometheus Alertmanager rule to trigger alerts when the Z-score exceeds the defined threshold for a specified duration. This allows teams to be notified of deviations from normal behavior without constant manual monitoring of the Prometheus UI. This straightforward method requires minimal data and configuration, making it perfect for day-one implementation in development environments.
The second, more advanced demo focused on setting up CubeFlow on a local machine to deploy a simple anomaly detection model. The steps involved:
- Local Environment Setup: Installing essential tools like
kind(for local Kubernetes clusters),kubectl, andkustomize. - Kubernetes Cluster & KServe Dependencies: Spinning up a local Kubernetes cluster and then installing KServe's critical dependencies:
- Istio: For ingress and service mesh capabilities, handling traffic routing.
- Cert Manager: For secure communication between services.
- Knative: Providing the foundational building blocks for serverless workloads, including model life cycling, networking, and autoscaling, upon which KServe is built.
- KServe Installation: Deploying KServe itself, which is the component responsible for taking a model and exposing it as a live API endpoint.
- Model Preparation: Using a simple Isolation Forest model from the
scikit-learnlibrary. A Python script was shown that loads time series data from a CSV, reshapes it, fits the Isolation Forest model, and saves the trained model as a Python pickle file. The key insight here is that KServe only needs this pickle file for inference, eliminating the need to containerize the training code or build complex custom images for simple models. - Model Deployment with KServe:
- The pickle file was served over HTTP from a local machine using a basic Python web server, allowing KServe to download it.
- An InferenceService YAML configuration was created, specifying the model's name, its HTTP location, and the machine learning framework used (in this case,
sklearn). - Applying this YAML to the Kubernetes cluster caused KServe to spin up the necessary infrastructure, fetch the model, and expose it via an HTTP endpoint.
This setup allows for rapid iteration and deployment of anomaly detection models, with predictions being made via API calls. The results can then be stored in Prometheus, visualized in dashboards, and integrated with existing alerting systems, providing a comprehensive, scalable anomaly detection solution from day one.
Defensive Implications
▶ Watch: Importance of meaningful metrics in anomaly detection (7:40)
The most significant defensive implication of day-one anomaly detection is the fundamental shift from a reactive to a proactive security and reliability posture. Traditionally, anomaly detection often kicks in only in production, after an incident has already occurred and teams are in "firefighting mode." By embedding anomaly detection throughout the development lifecycle, organizations can:
- Catch Performance Regressions Early: Integrating anomaly detection into CI environments allows for build-over-build analysis. Spikes in latency, increased resource consumption, or unexpected behavior can be flagged immediately after code changes, preventing these regressions from ever reaching staging or production. This significantly reduces the window of exposure to potentially vulnerable or unstable code.
- Identify Integration Bugs and Environment Drift: In staging environments, anomaly detection can pinpoint issues arising from interactions between services, misconfigurations, or subtle differences in data patterns compared to development. This helps validate assumptions made during development and ensures that the integrated system behaves as expected under more realistic conditions.
- Validate Development Assumptions: During the application development phase, developers can use anomaly detection to continuously validate their assumptions about how new features or changes will perform. This provides immediate feedback, allowing for rapid iteration and correction of issues before they become deeply embedded in the codebase.
- Shorten the Feedback Loop: By detecting anomalies closer to the source of change (e.g., a specific pull request or deployment), the feedback loop for developers is drastically shortened. This means less time spent on root cause analysis, as the scope of potential changes is much smaller, leading to more focused and efficient debugging.
- Reduce Frequency of Production Failures (Increase MTBF): The ultimate defensive gain is the reduction in the number of failures that reach production. By treating anomalies at different layers of the development cycle—development, CI, staging—teams can stop failures from propagating, thereby increasing the Mean Time Between Failures (MTBF). This not only improves system resilience but also frees up operational teams from constant incident response.
However, the speakers also acknowledge limitations and provide defensive strategies:
- Low Data Volume in Pre-Production: CI/staging environments typically have less data than production, making it harder for models to learn meaningful patterns. The defense here is to "keep it simple" with interpretable models and fine-tune thresholds based on domain knowledge.
- Higher False Positives: Pre-production environments are inherently noisier and more unstable. Defenders should anticipate a higher volume of false positives and focus on fine-tuning thresholds and model sensitivity.
- Overfitting to Unstable Patterns: Frequent model retraining in unstable environments can lead to overfitting. A robust approach involves using more generalizable models, less frequent retraining, or leveraging transfer learning.
- Contextual Differences: What constitutes an anomaly in staging might be normal in production, and vice-versa. Anomaly detection should "augment, not replace, traditional testing," providing an additional layer of insight rather than being the sole arbiter of system health.
In essence, day-one anomaly detection transforms observability from a diagnostic tool into a preventative one, making services more resilient and secure by catching issues at their earliest, least impactful stages.
Key Takeaways
- Anomaly detection is a first-mile development companion, not a last-mile operations tool. Integrate it from day one across the entire SDLC to proactively prevent failures.
- Focus on meaningful metrics and robust feature engineering. Quality over quantity in data instrumentation is crucial, and engineered features serve as the foundational "first model" for effective anomaly detection.
- Overcome the cold start problem with simple, interpretable methods. Leverage statistical models like Z-score, encode domain expertise, and utilize synthetic data to bootstrap anomaly detection even with limited historical data.
- Scale with Kubernetes-native ML platforms like CubeFlow. For complex data patterns and deep learning models, CubeFlow provides the necessary infrastructure and tools for distributed training, serving, and automated pipelines, abstracting away operational complexities.
- Embed anomaly detection across dev, CI, staging, and production environments. This multi-layered approach allows for early detection of performance regressions, integration bugs, and environment drifts, significantly increasing the Mean Time Between Failures (MTBF).
- Start simple, iterate, and augment traditional testing. Begin with lightweight models and fine-tune thresholds, gradually graduating to more complex models as systems mature, always treating anomaly detection as an enhancement to existing testing strategies.
About the Speaker(s)
Kruthika Prasanna Simha is a Machine Learning Engineer at Apple, where she works with the observability team. Her professional background spans the critical areas of observability, machine learning, and data science, bringing a holistic perspective to building resilient and intelligent systems.
Prashant Gupta is also a Machine Learning Engineer at Apple and a member of the observability team. His expertise lies in machine learning, natural language processing (NLP), and observability, enabling him to contribute to advanced solutions for monitoring and understanding complex system behaviors.
Reviews
Dr. Zero (Offensive Security Researcher) — STRONG ACCEPT
This talk from Apple engineers makes a compelling case for shifting anomaly detection from a reactive, post-production activity to a proactive, day-one development practice. It effectively addresses the 'cold start problem' for nascent services using practical, scalable solutions ranging from simple statistical methods with Prometheus to advanced deep learning pipelines orchestrated by CubeFlow. The focus on embedding anomaly detection throughout the entire SDLC to improve Mean Time Between Failures (MTBF) is a significant and actionable defensive innovation.
Heather Calloway (CISO) — STRONG ACCEPT
This talk from Apple on anomaly detection for observability is a compelling argument for shifting proactive incident prevention to the earliest stages of the software development lifecycle. By challenging conventional wisdom and providing practical, scalable approaches—from simple statistical methods to advanced ML pipelines—it makes a clear case for how embedding 'day one foresight' fundamentally improves system resilience, reduces business risk, and increases the Mean Time Between Failures. While the deep technical implementation details are for practitioners, the strategic implications for CISOs and security leaders are significant, advocating for a critical cultural and operational…