Limitless Possibilities, Consistent Design: Crafting Dashboards... Nicolas Takashi & Antoine Thébaud
Nicolas Takashi, Antoine Thébaud
KubeCon + CloudNativeCon Europe 2025 · Session
Overview
This talk, presented by Nicolas Takashi and Antoine Thébaud, introduces Perses, an innovative open-source observability visualization tool designed to standardize and streamline dashboard creation and management. As a recent addition to the CNCF sandbox project landscape, Perses aims to foster an open specification for dashboards, enhancing interoperability across diverse observability platforms. The core of the presentation revolves around the concept of Dashboard as Code, empowering engineers to define, manage, and deploy their observability dashboards using code, leveraging modern DevOps practices.
Key moments
- 0:00 Talk introduction and speaker introductions
- 1:00 Introduction to Perses: open observability visualization
- 2:00 Perses core features: extensibility, embeddability, GitOps
- 4:00 What is Dashboard as Code and its advantages
- 5:50 SDKs for crafting dashboards: Golang vs. Qlang
- 6:50 Introducing persi CLI for dashboard operations
- 7:00 Complete Dashboard as Code development lifecycle
- 8:00 Advanced dashboard validation and linting with persi lint
Limitless Possibilities, Consistent Design: Crafting Dashboards... Nicolas Takashi & Antoine Thébaud
Speakers: Nicolas Takashi, Observability Tech Lead at Coralogix; Antoine Thébaud, Senior Software Engineer at Amadeus
Conference: KubeCon EU
YouTube: https://www.youtube.com/watch?v=7h70Olo5Uzk
Overview
This talk, presented by Nicolas Takashi and Antoine Thébaud, introduces Perses, an innovative open-source observability visualization tool designed to standardize and streamline dashboard creation and management. As a recent addition to the CNCF sandbox project landscape, Perses aims to foster an open specification for dashboards, enhancing interoperability across diverse observability platforms. The core of the presentation revolves around the concept of Dashboard as Code, empowering engineers to define, manage, and deploy their observability dashboards using code, leveraging modern DevOps practices.
The speakers, both maintainers of the Perses project, highlight its key differentiators: a robust plug-in architecture, seamless embeddability into existing UIs, and a fundamentally GitOps friendly design. By treating dashboards as version-controlled code artifacts, Perses addresses common challenges in maintaining consistent, scalable, and auditable observability infrastructure. This approach not only facilitates collaboration among teams but also ensures that dashboards evolve with the underlying systems they monitor, thereby reducing operational overhead and improving incident response capabilities.
Background
▶ Watch: Talk introduction and speaker introductions (0:00)
The landscape of cloud-native observability often involves a fragmented set of tools and bespoke dashboard configurations, leading to inconsistencies, maintenance headaches, and a steep learning curve for new engineers. Traditional methods of creating dashboards through a UI, or even manually crafting YAML/JSON definitions, can be error-prone and difficult to scale across large organizations. This is where the concept of dashboard as code emerges as a critical solution, mirroring the success of infrastructure as code and policy as code. The idea is simple: describe your dashboards using a code language, store these definitions in a version control system like Git, and apply DevOps principles such as linting, unit stack testing, and automated deployment.
Perses was developed to provide a robust and cloud-native friendly solution for this paradigm. Beyond just offering a UI for dashboard creation, Perses provides a clean, Kubernetes-native data model, expressed as CRDs (Custom Resource Definitions). This allows dashboards to be managed directly within a Kubernetes environment using the Perses operator. Furthermore, Perses's plug-in architecture is designed for extensive customization, allowing users to create their own visualization options and integrate with various data sources. The upcoming V2 of this architecture promises even greater flexibility. Its embeddable nature, facilitated by npm packages, enables integration into other applications, as exemplified by Red Hat OpenShift, which embeds Perses visualizations directly into its console for a seamless user experience.
Key Findings
▶ Watch: Perses core features: extensibility, embeddability, GitOps (2:00)
The talk articulates several key findings and contributions of the Perses project towards advancing dashboard as code:
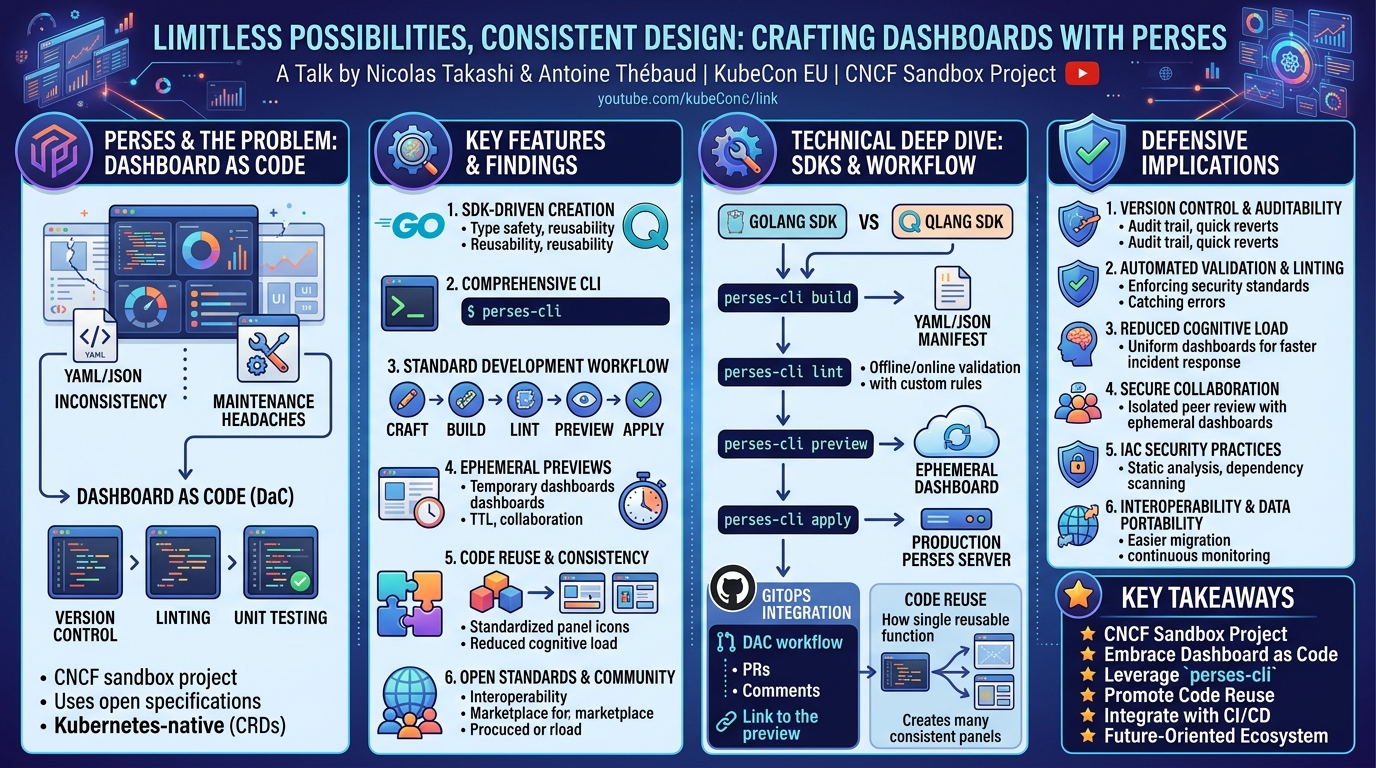
- SDK-Driven Dashboard Creation: Perses offers dedicated SDKs in Golang and Qlang for defining dashboards programmatically. This moves beyond manual YAML/JSON editing, providing type safety, reusability, and integration with existing programming ecosystems.
- Comprehensive CLI Tooling: The
perses-cliserves as a central interface for the entire dashboard as code lifecycle, enabling tasks from building and validating to deploying and previewing dashboards. - Standardized Development Workflow: A well-defined five-stage process (Craft, Build, Lint, Preview, Apply) promotes consistent and efficient dashboard development, easily integrated into CI/CD pipelines.
- Ephemeral Previews for Collaboration: The introduction of ephemeral dashboards with a time to live (TTL) significantly enhances the peer review process, allowing developers to share temporary, live previews of their changes without cluttering the production environment.
- Emphasis on Code Reuse and Consistency: The SDK approach encourages the extraction of common dashboard elements and panel configurations into reusable functions, leading to highly standardized and consistent dashboards across an organization. This reduces cognitive load during on-call rotations and ensures a uniform visual language.
- Commitment to Open Standards and Community: Perses is positioned as an initiative to drive an open specification for dashboards, fostering interoperability. Future plans include a marketplace for sharing community dashboards and plugins, further extending its reach and utility.
Technical Deep Dive
▶ Watch: SDKs for crafting dashboards: Golang vs. Qlang (5:50)
At the heart of Perses's dashboard as code implementation are its SDKs and the versatile perses-cli. These tools collectively enable a robust, GitOps-friendly workflow for managing observability dashboards.
SDKs for Programmatic Dashboard Definition
Perses currently supports two primary SDKs for defining dashboards: the Golang SDK and the Qlang SDK. Each offers distinct advantages:
- Golang SDK: This SDK leverages the full power of the Go ecosystem. Developers can utilize Go's robust type system, extensive standard library, and powerful testing frameworks to define dashboards. This allows for complex logic, code reuse through functions, and thorough unit testing of dashboard definitions before deployment. The speakers noted that the Golang SDK is currently more popular based on community feedback.
- Qlang SDK: While not offering the same breadth of general-purpose programming capabilities as Golang, the Qlang SDK is designed to align more closely with Perses's native schema features. Qlang is a data configuration language, making it inherently suitable for defining structured data like dashboard configurations with strong validation capabilities.
The choice between SDKs often depends on an organization's existing technology stack and developer preferences. The project is open to supporting new languages in the future, welcoming contributions from the community.
The perses-cli Workflow
The perses-cli is the command-line interface that orchestrates the dashboard as code lifecycle. It provides a suite of commands that can be integrated into CI/CD pipelines:
perses-cli build: After crafting a dashboard using an SDK (e.g., in Go), this command compiles the code into a standard Perses dashboard definition, typically in YAML or JSON format. This manifest is the deployable artifact that Perses understands. The output is designed to be Kubernetes-friendly, reflecting the project's cloud-native ethos.perses-cli lint: This crucial step validates the generated dashboard definition. It offers two modes:
- Offline Validation: Performs structural checks against the Perses schema, ensuring the manifest is well-formed.
- Online Validation: Connects to a running Perses server to verify if all referenced plugins and data sources are available on that specific instance.
The linting capabilities are highly extensible. Organizations can define custom rules using JSON path expressions combined with common language expressions. This allows enforcing company-specific naming conventions (e.g., snake_case for dashboard names) or specific panel configurations (e.g., all time series panels must use a table legend with min, max, and average values).
perses-cli preview: This innovative feature is designed to facilitate collaborative review. It deploys an ephemeral dashboard to a Perses server. These dashboards are temporary, automatically deleted after a configurable time to live (TTL). When a pull request (PR) is opened, the CI/CD pipeline can triggerperses-cli preview, providing a direct link to a live, temporary version of the dashboard for reviewers. This allows for immediate visual feedback without impacting the production environment.perses-cli apply: Once a dashboard has been reviewed, linted, and approved,perses-cli applydeploys the final, persistent dashboard to the Perses server. In a Kubernetes context, this could involve applying the generated CRD to the cluster, where the Perses operator would then manage its lifecycle.
GitOps Integration and Code Reuse
The entire perses-cli workflow is designed for seamless integration with GitOps practices. The talk specifically highlighted the use of GitHub Actions through a dedicated DAC workflow. This workflow intelligently handles PRs by creating ephemeral preview dashboards and manages deployments to the main branch by applying persistent dashboards.
A significant advantage of the SDK approach is the promotion of code reuse. Developers can encapsulate common dashboard patterns or panel configurations into reusable functions within their chosen SDK language. For instance, a standardized legend style for all time series panels, including min, max, and average values, can be defined once as a Go function and then imported across multiple dashboards. This not only reduces code duplication but also enforces consistency, ensuring that all dashboards adhere to organizational standards and best practices, thereby reducing cognitive load for engineers during critical monitoring tasks.
Open Specification and Interoperability
Perses is not just a tool; it's an initiative. The project's commitment to an open specification for dashboards aims to increase interoperability across the observability ecosystem. The speakers mentioned D-Zero, an open-source project focused on Prometheus data, as an example of a tool that already supports the Perses format, allowing for export and import of dashboards. This vision of a standardized dashboard format could pave the way for easier migration and sharing of observability insights between different platforms.
Demo / Proof of Concept
▶ Watch: Introducing persi CLI for dashboard operations (6:50)
The speakers presented a recorded demo showcasing the Golang SDK and the perses-cli in action, illustrating the complete dashboard as code lifecycle.
The demonstration began with a new, empty Golang project. The first steps involved pulling Perses dependencies and creating a minimal dashboard definition in Go, including basic metadata like the dashboard name, project, data source reference, and refresh duration. The power of the Go SDK was immediately apparent, allowing the use of standard Go libraries like flag to make dashboards customizable via external parameters during the build process.
Running perses-cli build transformed this Go code into a Kubernetes-native YAML definition, showcasing the clean, familiar structure. To facilitate local development, the demo showed how to spin up a Perses Docker container and mount the generated dashboard YAML as a volume. This enabled live updates: as changes were made to the Go code and rebuilt, the local Perses instance automatically reloaded and displayed the updated dashboard, providing immediate visual feedback.
The demo then progressed to adding actual time series panels and table panels to the dashboard, referencing the previously defined data source. Once the dashboard was ready, the typical Git workflow was followed: commit, push, and open a pull request. This triggered a GitHub Action which automatically executed the perses-cli workflow: building, linting, and crucially, creating a preview dashboard.
A key highlight was the automatic comment posted by the GitHub Action on the PR, containing a direct link to the ephemeral dashboard. This preview dashboard was uniquely named (e.g., my-dashboard-PR#123), providing a live, temporary instance of the proposed changes. This feature is invaluable for reviewers, allowing them to compare the new version with the existing one side-by-side.
Further into the demo, the speakers emphasized the importance of code reuse. They demonstrated how to extract common configurations, such as a standardized legend style (e.g., table style with min, max, and average) for all time series panels, into a reusable Go function. This ensures consistency across dashboards and reduces boilerplate code. When a new panel was added using this reusable function, opening another PR generated a new ephemeral preview, along with a diff of the final YAML/JSON payload. This diff provides an additional layer of verification, allowing reviewers to see the exact changes that will be pushed to the server.
The demo concluded by reinforcing that this entire process – from crafting code to reviewing ephemeral previews and applying final dashboards – is designed to be seamless, automated, and integrated into modern development workflows.
Defensive Implications
▶ Watch: Advanced dashboard validation and linting with persi lint (8:00)
The adoption of dashboard as code with Perses carries significant defensive implications, enhancing the security posture and operational resilience of an organization's observability infrastructure.
- Version Control and Auditability: By defining dashboards in code and storing them in Git, every change is version-controlled. This provides a complete audit trail of who made what changes, when, and why. In the event of a misconfiguration leading to a critical incident, defenders can quickly identify the offending change and revert to a known good state, significantly reducing mean time to recovery (MTTR).
- Automated Validation and Linting: The
perses-cli lintcommand, especially with its custom rule capabilities, acts as a critical defensive gate. It enforces organizational standards, ensuring dashboards adhere to security best practices (e.g., preventing sensitive information from being displayed, ensuring consistent access control configurations if part of the schema). Automated checks catch errors and policy violations before dashboards are deployed, preventing potential operational security risks. - Reduced Cognitive Load During Incidents: Consistent dashboard design, enforced through code reuse and standardization, means that during an incident, on-call engineers don't waste precious time deciphering unfamiliar layouts or inconsistent metrics. This uniformity, which the SDKs encourage, directly contributes to faster problem identification and resolution, which is a key aspect of operational defense.
- Secure Collaboration and Review: The ephemeral dashboards feature allows for safe peer review of changes. Instead of directly modifying production dashboards or sharing static screenshots, reviewers can interact with a live, temporary version. This isolates development changes from the production environment, reducing the risk of accidental misconfigurations or unauthorized deployments.
- Infrastructure-as-Code Security Practices: Treating dashboards as code means they can be subjected to the same security scanning and best practices applied to other infrastructure as code artifacts. This includes static analysis, dependency scanning, and integration into existing security pipelines, extending security controls to the observability layer.
- Interoperability and Data Portability: While not directly a defensive measure, the push for an open specification for dashboards can indirectly aid defenders. Should an organization need to migrate observability platforms or share data with security analysis tools, a standardized format like Perses aims for will make these transitions smoother and less prone to data loss or misinterpretation, ensuring continuous monitoring capabilities.
Key Takeaways
- Perses is a CNCF Sandbox Project: It's an observability visualization tool committed to an open specification for dashboards, aiming to increase interoperability across tools.
- Embrace Dashboard as Code: Utilize Golang SDK or Qlang SDK to define dashboards programmatically, bringing GitOps principles, version control, and automation to observability.
- Leverage
perses-clifor Lifecycle Management: The command-line interface provides essential tools for building, linting (with custom rules), previewing ephemeral dashboards, and applying final configurations. - Promote Code Reuse and Consistency: SDKs enable the extraction of common dashboard elements into reusable functions, leading to standardized, consistent, and easily maintainable dashboards, which reduces cognitive load during incident response.
- Integrate with CI/CD: The DAC workflow in GitHub Actions streamlines the development process, automating validation, preview generation, and deployment for a robust and efficient workflow.
- Future-Oriented Ecosystem: Look forward to a marketplace for sharing community dashboards and plugins, further extending Perses's capabilities and fostering a collaborative environment.
About the Speaker(s)
Nicolas Takashi is an Observability Tech Lead at Coralogix. He is a prominent contributor to the cloud-native observability ecosystem, serving as a maintainer for both the Prometheus Operator and the Perses project. His work extends to pushing code on other significant CNCF projects such as Tenos, OpenTelemetry, and Prometheus, underscoring his deep expertise in observability tooling and infrastructure.
Antoine Thébaud is a Senior Software Engineer at Amadeus, where he contributes to their observability platform. He has been a maintainer of the Perses project for several years, bringing extensive experience in developing and managing observability solutions. His long-standing involvement highlights his commitment to fostering open standards and improving the way organizations visualize and understand their systems.
Reviews
Dr. Zero (Offensive Security Researcher) — STRONG ACCEPT
This talk introduces Perses, a CNCF sandbox project that delivers a robust "Dashboard as Code" solution. Leveraging dedicated SDKs, a powerful CLI, and Kubernetes-native design, it tackles critical observability challenges like consistency, scalability, and auditability. The project's emphasis on GitOps, ephemeral preview dashboards, and custom linting rules demonstrates a pragmatic and well-engineered approach to a problem that's often overlooked. This isn't just another dashboard tool; it's a serious contender for standardizing observability visualization.
Heather Calloway (CISO) — STRONG ACCEPT
This talk on Perses and the "Dashboard as Code" (DAC) paradigm presents a compelling approach to standardizing observability, directly addressing critical challenges in auditability, risk management, and incident response. By treating dashboards as version-controlled code artifacts, it enforces consistency, automates validation, and provides a clear, auditable trail of changes, significantly enhancing operational resilience and reducing the cognitive load on security and operations teams during critical events. This represents a mature, engineering-driven solution to a pervasive operational problem with clear governance implications.