Using eBPF for Non-invasive, Performant, Instant Network Monitoring - Mario Macías & Marc Tudurí
Mario Macías, Marc Tudurí
KubeCon + CloudNativeCon Europe 2025 · Session
Overview
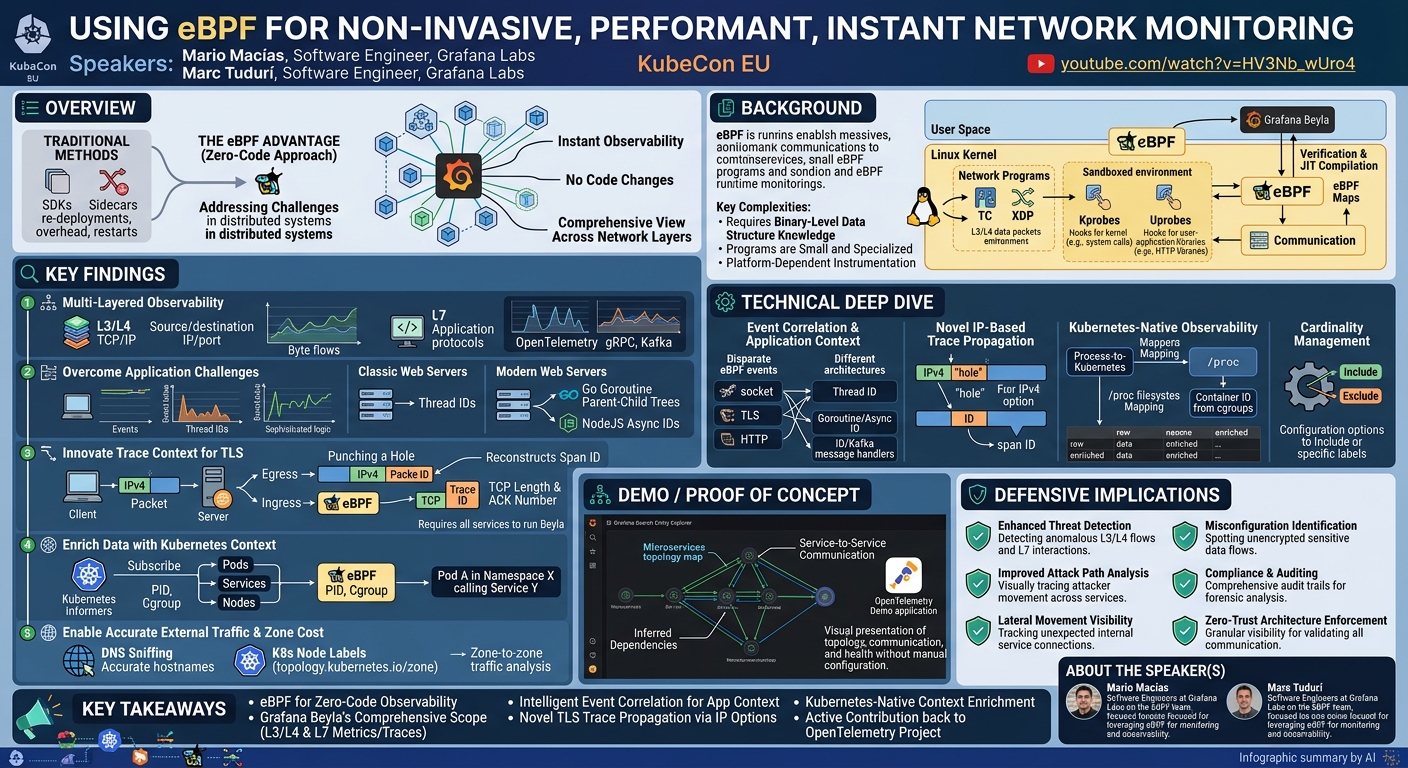
In this insightful KubeCon EU session, Mario Macías and Marc Tudurí from Grafana Labs unveiled how eBPF (extended Berkeley Packet Filter) is being leveraged to deliver non-invasive, performant, and instant network monitoring, particularly within complex Kubernetes environments. Their presentation highlighted Grafana Beyla, an innovative solution designed to provide deep observability into network connections and application-level interactions without requiring any code changes or redeployments of instrumented applications.
Key moments
- 0:00 Introduction to eBPF network monitoring by Grafana Labs
- 0:30 eBPF fundamentals and its role in Grafana Beyla
- 2:00 Various eBPF program types for non-invasive instrumentation
- 3:45 eBPF limitations: binary-level knowledge and program size
- 4:25 Grafana Beyla: Zero-code, automatic instrumentation for network monitoring
- 6:00 Instrumentation challenges: language-specific probes for Go/Java
- 7:45 Aggregating eBPF events into meaningful application-level traces
Using eBPF for Non-invasive, Performant, Instant Network Monitoring
Speakers: Mario Macías, Software Engineer, Grafana Labs; Marc Tudurí, Software Engineer, Grafana Labs
Conference: KubeCon EU
YouTube: https://www.youtube.com/watch?v=HV3Nb_wUro4
Overview
In this insightful KubeCon EU session, Mario Macías and Marc Tudurí from Grafana Labs unveiled how eBPF (extended Berkeley Packet Filter) is being leveraged to deliver non-invasive, performant, and instant network monitoring, particularly within complex Kubernetes environments. Their presentation highlighted Grafana Beyla, an innovative solution designed to provide deep observability into network connections and application-level interactions without requiring any code changes or redeployments of instrumented applications.
The talk addressed critical challenges in modern distributed systems monitoring, where traditional methods often fall short in dynamic, microservice-rich landscapes. By tapping into the Linux kernel's eBPF capabilities, Beyla aims to offer a comprehensive view across multiple layers of the network stack, from raw IP/port data to high-level application protocol details, and even trace context propagation. This zero-code approach significantly reduces the operational overhead associated with instrumentation, making advanced observability more accessible and robust.
The significance of this work extends beyond mere monitoring; it empowers developers and operators with unprecedented visibility into the health, performance, and security posture of their applications. By correlating low-level network events with high-level Kubernetes metadata and application traces, Beyla provides a holistic understanding of how services interact, where bottlenecks occur, and how traffic flows, even across secure connections where traditional methods struggle.
Background
▶ Watch: Introduction to eBPF network monitoring by Grafana Labs (0:00)
The landscape of modern cloud-native applications, particularly those deployed on Kubernetes, presents significant challenges for observability. Applications are increasingly distributed, dynamic, and rely on complex inter-service communication. Traditional monitoring often involves modifying application code with SDKs, deploying sidecars, or relying on less granular infrastructure-level metrics. These approaches can introduce overhead, require application restarts, or provide insufficient detail for diagnosing intricate issues.
eBPF emerges as a powerful paradigm shift in this context. It allows for the execution of sandboxed programs within the Linux kernel, enabling highly efficient and safe instrumentation without modifying the kernel source code or loading kernel modules. As explained by the speakers, an eBPF-based solution like Grafana Beyla runs as a user-space application but interacts with the eBPF runtime in the kernel. This kernel component provides verification and Just-In-Time (JIT) compilation for safe access to kernel resources, along with eBPF maps for user-kernel communication and helper APIs for program loading.
eBPF is not a monolithic solution but rather a collection of small, specialized programs injected into various parts of the operating system. These can include network programs (e.g., in traffic control or Express Data Path (XDP) for L3/L4 data), Kprobes (triggered by kernel events), and Uprobes (hooked into user-space applications or libraries). The key advantages of eBPF are its non-invasiveness (no application rebuild or redeployment needed), native performance (JIT compilation), and safety (pre-verification prevents kernel hangs).
However, eBPF is not without its complexities. It demands API-level knowledge (specifically, binary-level data structure understanding) of the instrumented targets. Programs are also limited in size and functionality, necessitating the coordination of multiple small programs to achieve comprehensive instrumentation. Furthermore, instrumentation is highly platform-dependent; different programming languages (C, Rust, Python vs. Go, Java) and frameworks might bundle their own libraries (e.g., for TLS), requiring specific probing strategies. This inherent complexity underscores the need for sophisticated tools like Beyla to abstract away these low-level details and provide actionable insights.
Key Findings
▶ Watch: Various eBPF program types for non-invasive instrumentation (2:00)
The Grafana Labs team presented Grafana Beyla as their solution for zero-code, automatic instrumentation and network monitoring. Beyla's core contributions and findings revolve around its ability to:
- Provide Multi-Layered Observability: It delivers both robust L3/L4 network connection metrics (source/destination IPs, ports, byte flows) directly from the kernel's TCP/IP stack, and richer L7 application-level metrics (HTTP methods, gRPC calls, Kafka messages, payloads, return codes) conforming to the OpenTelemetry specification. This unified view bridges the gap between network infrastructure and application behavior.
- Overcome Application-Specific Instrumentation Challenges: While L3/L4 metrics are relatively stable due to reliance on standard Linux kernel APIs, L7 application metrics are highly dependent on internal implementation details of frameworks and languages. Beyla intelligently adapts its probing strategy:
- For classic web servers, it uses thread IDs to correlate events.
- For modern, asynchronous web servers (e.g., Go, NodeJS), it employs more advanced techniques like tracking Go goroutine parent-child trees or NodeJS async IDs to correctly group related events. This highlights the sophisticated logic required to make sense of disparate eBPF events.
- Innovate Trace Context Propagation for TLS: A significant challenge for eBPF-based tracing is propagating context across secure (TLS) connections, as the encrypted payload cannot be modified. Beyla introduces a novel approach using IPv4 options within the network packet itself. By "punching a hole" in the packet and embedding a trace ID (part of the OpenTelemetry
traceparentheader), it enables context propagation even through TLS. It further reconstructs the span ID on the ingress side by leveraging the uniqueness of TCP length and TCP acknowledgment numbers.
- Enrich Data with Kubernetes Context: Raw network and application metrics gain immense value when correlated with Kubernetes metadata. Beyla uses Kubernetes Informers to subscribe to events from pods, services, and nodes. It then maps low-level process information (PID, cgroup) to Kubernetes entities, allowing users to understand which Kubernetes services are calling others, rather than just raw IPs or process names (e.g., "inventory service in backend namespace" instead of "java command line").
- Enable Accurate External Traffic Monitoring and Zone Cost Inference: Beyla accurately identifies external hostnames by sniffing DNS traffic, providing more precise external service names than simple reverse DNS lookups. Furthermore, by leveraging Kubernetes node labels like
topology.kubernetes.io/zone, it can infer and quantify traffic flowing between different availability zones, enabling cost analysis and network optimization.
Technical Deep Dive
▶ Watch: eBPF limitations: binary-level knowledge and program size (3:45)
Grafana Beyla's architecture orchestrates multiple eBPF programs and user-space components to achieve its comprehensive monitoring goals. At its core, Beyla deploys a variety of eBPF programs tailored to different layers of the network stack and application runtime.
eBPF Program Deployment and Data Collection:
- Network Programs: For L3/L4 metrics, Beyla injects eBPF programs into the kernel's traffic control (TC) layer or Express Data Path (XDP). These programs capture fundamental connection details such as source/destination IPs and ports, packet sizes, and interface information. This forms the basis for metrics like
bail_network_flow_bytes, which quantifies byte flow between endpoints. These programs are robust due to their reliance on stable kernel APIs. - Kprobes: These are attached to specific kernel functions to gather more context, such as hostnames and connection details beyond basic IP/port.
- Uprobes: For L7 application-level metrics, Uprobes are strategically placed within user-space libraries (e.g.,
libc,libssl,httplibraries) or directly into application executables. These probes extract richer data like HTTP methods, URLs, gRPC service calls, Kafka message details, payloads, and return codes. The challenge here is the binary-level knowledge required, as different languages (C, Rust, Python, Go, Java) and their runtimes handle libraries and system calls differently. Go and Java, for instance, often bundle their own TLS implementations, necessitating specific Uprobe placements.
Event Correlation and Application Context:
The raw events from these disparate eBPF programs are like "puzzle pieces" that need to be assembled.
- Classic Web Servers: For older, thread-per-request models, Beyla uses the thread ID. Events from different sources (socket, TLS, HTTP) associated with the same thread ID are correlated to reconstruct a complete request-response cycle, including total transaction time, method, payload size, and response code.
- Modern Web Servers (Event Loops): Modern asynchronous frameworks (e.g., Go, NodeJS) use event loops and a small pool of threads, making thread ID insufficient for correlation. Beyla adapts by:
- For Go applications: Maintaining a tree of parent-child goroutines to link related events.
- For NodeJS: Utilizing the framework's async ID.
- For Kafka: Tracking pointers to message handlers.
This sophisticated, implementation-dependent logic is crucial for accurate L7 metric generation, though it means Beyla needs explicit support for new frameworks and can be sensitive to internal library updates.
Novel IP-Based Trace Context Propagation:
A significant technical hurdle is propagating OpenTelemetry trace context across services, especially when TLS is involved, as eBPF cannot modify encrypted payloads. Beyla's innovative solution relies on IPv4 options:
- Punching a Hole: When an eBPF program detects an outgoing request (e.g., HTTP), it "punches a hole" in the IPv4 packet header to create space for an IPv4 option.
- Embedding Trace ID: Beyla extracts the
trace IDfrom the OpenTelemetrytraceparentheader (which identifies a group of related requests) and embeds it into this IPv4 option. Due to the limited size of IPv4 options, only thetrace IDcan be transmitted, not thespan ID(which identifies an individual request within a trace). - Reconstructing Span ID: On the ingress side, another eBPF program reads the embedded
trace ID. To reconstruct thespan IDand uniquely identify the request, Beyla leverages the TCP length and TCP acknowledgment number. These values are expected to be unique for a given TCP segment, allowing Beyla to infer thespan IDand link it to the correct request.
This method allows context propagation across secure boundaries, a significant advancement. However, a limitation is that for full trace reconstruction, all services in the call chain must be instrumented with Beyla, unlike standard OpenTelemetry SDKs which can interoperate more broadly.
Kubernetes-Native Observability:
To transform raw network data into meaningful insights for Kubernetes users, Beyla integrates deeply with the Kubernetes API:
- Kubernetes Informers: Beyla subscribes to
InformersforPods,Services, andNodesvia the Kubernetes API Go client. This allows it to receive real-time updates on resource creation, modification, and deletion. - Process-to-Kubernetes Mapping: eBPF programs provide the Process ID (PID) and command line of the instrumented application. Beyla uses the
/procfilesystem to fetch the cgroup associated with the PID. The cgroup, in turn, contains the container ID, which can then be mapped to a specificPod,Service, andNamespaceusing the Kubernetes Informer data. This enrichment transforms generic "Java process" metrics into "inventory service in backend namespace" metrics. - Zone Traffic Analysis: By fetching the
node namefrom thePodand then reading thetopology.kubernetes.io/zonelabel from theNodeobject, Beyla can enrich network flow bytes with source and destination zone information. This enables calculating metrics like total bytes exchanged between zones, facilitating cost analysis and network optimization. - Accurate External Hostname Resolution: Instead of relying on potentially inaccurate or delayed reverse DNS lookups, Beyla directly sniffs DNS traffic using eBPF. When an instrumented application makes a DNS query, Beyla captures the actual hostname returned, enriching network flow bytes with the destination hostname (e.g.,
golang.org) rather than just an IP address or a generic reverse lookup result.
Cardinality Management:
With the wealth of labels and metrics generated, cardinality explosion is a concern. Beyla addresses this by providing configuration options to explicitly include or exclude specific labels for individual metrics, giving users control over their monitoring data volume.
Demo / Proof of Concept
▶ Watch: Instrumentation challenges: language-specific probes for Go/Java (6:00)
The speakers demonstrated the practical utility of Grafana Beyla by showcasing its integration with Grafana Search and the Entity Explorer.
The demonstration involved deploying the OpenTelemetry Demo microservices application – a simulated e-commerce platform – into a Kubernetes cluster. This demo application consists of numerous microservices communicating with each other, representing a typical complex cloud-native environment.
With Beyla enabled within this cluster, the Grafana Search Entity Explorer was able to visually represent the entire topology of the deployed services. Users could observe:
- Service-to-Service Communication: Clearly illustrating which services were calling others (e.g., a "Chrome client" calling a "front-end proxy," which then calls a "front-end" service).
- Network Topology: A visual map of how different components of the microservices architecture were interconnected.
- Inferred Dependencies: Beyla's ability to automatically instrument and correlate events allowed the Entity Explorer to build this dependency graph without any manual configuration or code changes to the OpenTelemetry Demo application itself.
This demonstration effectively validated Beyla's core value proposition: providing instant, zero-code, and comprehensive observability into complex distributed systems, making it easier for users to understand network flows, application interactions, and overall system health.
Defensive Implications
▶ Watch: Aggregating eBPF events into meaningful application-level traces (7:45)
The detailed, non-invasive network and application monitoring capabilities provided by Grafana Beyla, powered by eBPF, offer significant advantages for cybersecurity defense:
- Enhanced Threat Detection: By providing real-time visibility into both L3/L4 network flows and L7 application interactions, Beyla can help detect anomalous behavior. Defenders can identify unusual communication patterns (e.g., a service communicating with an unexpected external IP or an internal service making unauthorized calls), which could indicate command-and-control (C2) activity, data exfiltration attempts, or lateral movement within the network.
- Improved Attack Path Analysis: The ability to trace inter-service dependencies and application-level transactions (including methods, payloads, and return codes) provides a clearer picture of how an attacker might move through an application or microservice architecture. This granular visibility helps security teams map potential attack paths and prioritize defensive measures.
- Lateral Movement Visibility: Beyla's detailed network flow metrics, enriched with Kubernetes context, are crucial for detecting lateral movement. If an attacker compromises one service, Beyla can track its subsequent attempts to connect to other internal services, revealing the spread of a breach. The IP-based trace context propagation, even with its caveats, offers a novel way to track activity across encrypted internal channels that might otherwise be opaque.
- Misconfiguration Identification: Unintended or insecure communication patterns, such as sensitive data being sent over unencrypted HTTP instead of HTTPS, or services communicating with deprecated endpoints, can be quickly identified. This helps in pinpointing and rectifying security misconfigurations before they are exploited.
- Compliance and Auditing: The comprehensive logging of network connections and application transactions provides an invaluable audit trail. In the event of an incident, this data can be used for forensic analysis, understanding the scope of compromise, and demonstrating compliance with regulatory requirements.
- Zero-Trust Architecture Enforcement: Implementing a zero-trust model requires granular visibility into every network flow and application interaction. Beyla's capabilities allow organizations to monitor and verify that only authorized communications occur, helping to enforce zero-trust policies effectively. The ability to identify traffic between Kubernetes services and even different availability zones (
topology.kubernetes.io/zone) further strengthens segmentation strategies.
Key Takeaways
- eBPF for Zero-Code Observability: eBPF offers a powerful, non-invasive, and performant mechanism for instrumenting the Linux kernel and user-space applications without requiring code changes or redeployments.
- Grafana Beyla's Comprehensive Scope: Beyla leverages eBPF to provide both robust L3/L4 network metrics and rich L7 application-level metrics and traces, adhering to the OpenTelemetry specification.
- Intelligent Event Correlation: To provide meaningful application context, Beyla employs sophisticated logic to correlate disparate eBPF events, adapting its strategy for different application architectures (e.g., thread IDs for classic servers, goroutine trees for Go, async IDs for NodeJS).
- Novel TLS Trace Propagation: Beyla introduces an innovative IP-based trace context propagation method using IPv4 options to overcome the challenges of observing secure (TLS) connections, utilizing TCP length and acknowledgment numbers for span ID reconstruction.
- Kubernetes-Native Context: By integrating with Kubernetes Informers and mapping process information to K8s resources, Beyla enriches raw eBPF data with essential Kubernetes metadata, enabling insights into service-to-service communication, zone traffic, and accurate external hostname resolution.
- Open Source Contribution: Grafana Beyla, initially a fork of OpenTelemetry Go instrumentation, is actively being donated back to the OpenTelemetry project, fostering community collaboration around eBPF-based auto-instrumentation.
About the Speaker(s)
Mario Macías is a Software Engineer at Grafana Labs, where he works as part of the eBPF team. His expertise lies in leveraging eBPF technology to develop advanced monitoring and observability solutions.
Marc Tudurí is also a Software Engineer at Grafana Labs, collaborating with Mario Macías on the eBPF team. His work focuses on utilizing eBPF for non-invasive network monitoring and improving observability in cloud-native environments.
Reviews
Dr. Zero (Offensive Security Researcher) — MUST SEE
This talk presents Grafana Beyla, a groundbreaking eBPF-powered solution for zero-code, multi-layered network and application monitoring in Kubernetes. Its deep technical dive into L7 correlation across diverse language runtimes and, critically, a novel IPv4 option-based trace context propagation for TLS connections, elevates it beyond typical observability discussions. The practical impact on security, operations, and cost management in cloud-native environments is immense, making this a pivotal piece of research.
Heather Calloway (CISO) — STRONG ACCEPT
This KubeCon session on using eBPF for non-invasive network monitoring, specifically with Grafana Beyla, presents a highly credible and operationally significant advancement for cloud-native security. The ability to achieve multi-layered, zero-code observability from L3/L4 network flows to L7 application interactions, enriched with Kubernetes context, directly addresses critical challenges in threat detection, incident response, and enforcing zero-trust principles in complex microservice environments. While technically deep, the clear articulation of its defensive implications and operational benefits makes this a strong recommendation for security leaders grappling with visibility gaps.