C.A.L.L.I.N.G. Now I'm Calling You, Calling You Now - Mario Macías & Terra Tauri, Grafana Labs
Mario Macías, Terra Tauri, Grafana Labs
KubeCon + CloudNativeCon Europe 2025 · Session
Overview
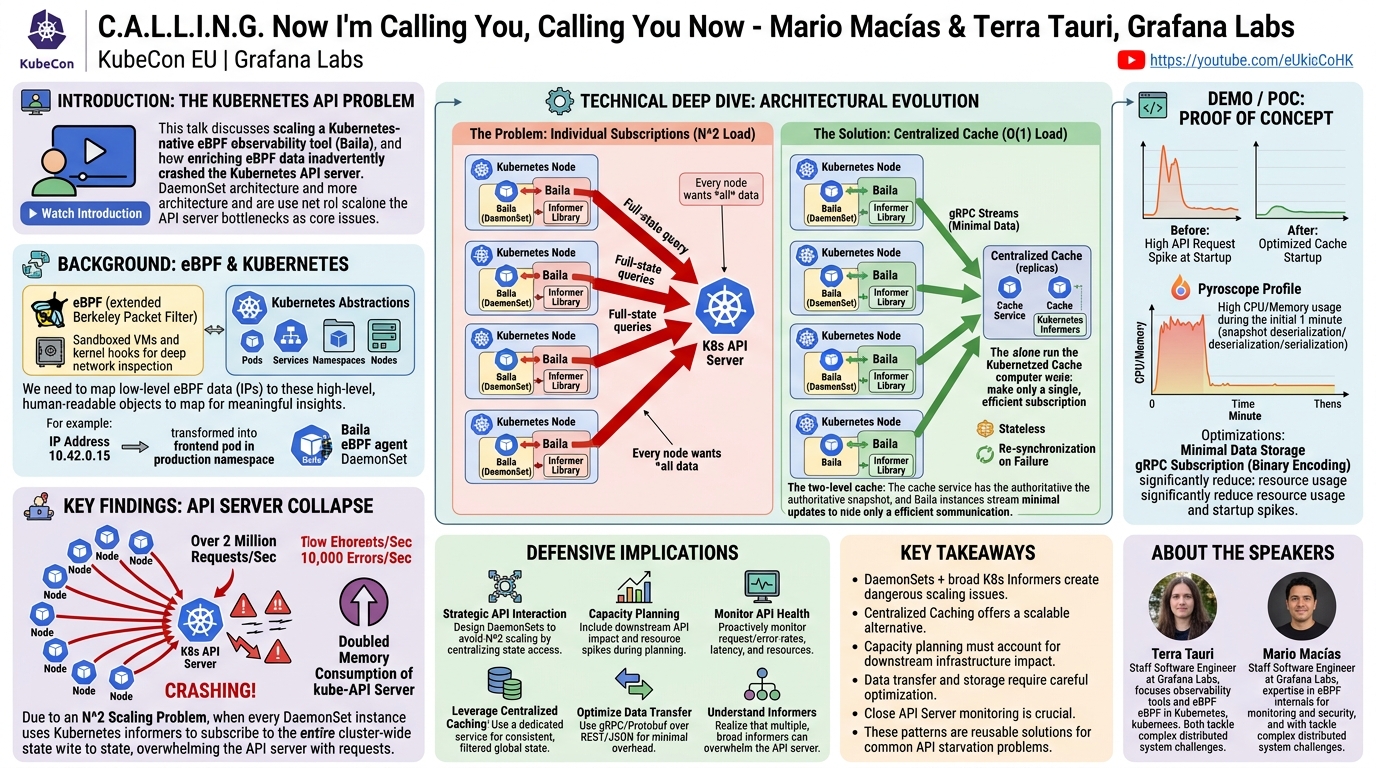
This talk, "C.A.L.L.I.N.G. Now I'm Calling You, Calling You Now," presented by Mario Macías and Terra Tauri from Grafana Labs, delves into a critical operational challenge encountered when deploying a Kubernetes-native eBPF-based observability tool at scale. The speakers recount how their efforts to enrich raw eBPF network data with meaningful Kubernetes metadata inadvertently led to a severe degradation and eventual collapse of the Kubernetes API server itself. The core of the problem stemmed from a common pattern of using Kubernetes informers within a DaemonSet architecture, which, when scaled, exposed a fundamental bottleneck in how the Kubernetes API handles cluster-wide state subscriptions.
Key moments
- 0:00 Introduction: The Kubernetes API problem
- 2:00 eBPF fundamentals: Safe kernel extension
- 3:30 Why raw kernel data isn't useful in Kubernetes
- 4:40 Initial approach: Tempting Kubernetes API for metadata
- 6:30 Kubernetes Informers: How metadata enrichment works
- 8:50 Crushing the Kubernetes API: 2M requests/sec
C.A.L.L.I.N.G. Now I'm Calling You, Calling You Now - Mario Macías & Terra Tauri, Grafana Labs
Speakers: Mario Macías, Staff Software Engineer, Grafana Labs; Terra Tauri, Staff Software Engineer, Grafana Labs
Conference: KubeCon EU
YouTube: https://www.youtube.com/watch?v=2BIhTXQd0CI
Overview
This talk, "C.A.L.L.I.N.G. Now I'm Calling You, Calling You Now," presented by Mario Macías and Terra Tauri from Grafana Labs, delves into a critical operational challenge encountered when deploying a Kubernetes-native eBPF-based observability tool at scale. The speakers recount how their efforts to enrich raw eBPF network data with meaningful Kubernetes metadata inadvertently led to a severe degradation and eventual collapse of the Kubernetes API server itself. The core of the problem stemmed from a common pattern of using Kubernetes informers within a DaemonSet architecture, which, when scaled, exposed a fundamental bottleneck in how the Kubernetes API handles cluster-wide state subscriptions.
The presentation provides a detailed technical breakdown of the issue, exploring the underlying causes of the API server overload, the diagnostic process, and the iterative development of a robust, scalable solution. This talk is highly relevant for anyone operating Kubernetes clusters, especially those deploying DaemonSets, building observability tools, or interacting heavily with the Kubernetes API. It offers invaluable lessons in distributed system design, API interaction patterns, and the often-unforeseen performance implications of seemingly benign architectural choices in a dynamic containerized environment.
Background
▶ Watch: Introduction: The Kubernetes API problem (0:00)
The foundation of this talk lies in eBPF (extended Berkeley Packet Filter), a powerful Linux kernel technology that enables safe and efficient extension of kernel functionality without modifying kernel source code or loading kernel modules. Unlike traditional kernel modules, eBPF programs run in a sandboxed virtual machine within the kernel, ensuring system stability even if a program misbehaves. Introduced to the Linux kernel in 2015, eBPF capabilities, particularly the TC egress/ingress hooks, allow for deep inspection and manipulation of network traffic directly at the kernel level. This makes eBPF an ideal candidate for high-performance network observability, security, and traffic engineering.
Grafana Labs leveraged eBPF to snoop on network traffic, aiming to construct comprehensive service graphs and provide detailed network metrics. However, raw kernel data, such as source IP, source port, destination IP, and destination port, is inherently low-level and often lacks contextual meaning in a Kubernetes environment. In Kubernetes, users and operators are primarily concerned with high-level abstractions like Pods, Services, Namespaces, and Nodes. An IP address, while technically precise, is ephemeral and provides little immediate insight without being mapped back to its corresponding Kubernetes object. For instance, knowing that 10.42.0.15 is communicating with 10.42.1.20 is far less useful than knowing "the frontend pod in production namespace is talking to the database service in backend namespace."
To bridge this gap and transform raw eBPF network data into human-readable, Kubernetes-centric insights, Grafana Labs developed Baila, an eBPF-based observability agent. Baila was designed to run as a DaemonSet within Kubernetes. A DaemonSet ensures that one instance of a pod runs on each node in the cluster, making it perfectly suited for collecting node-specific kernel data via eBPF. The challenge then became how to efficiently enrich this node-local kernel data with cluster-wide Kubernetes metadata. The most obvious and tempting solution was to leverage the Kubernetes API, which serves as the single source of truth for all cluster state. Each Baila instance, running on its respective node, would query the Kubernetes API to retrieve metadata about pods, services, and nodes, enabling the crucial mapping of IP addresses to Kubernetes objects. This approach, while seemingly straightforward, ultimately led to the catastrophic API server meltdown that formed the central narrative of the talk.
Key Findings
▶ Watch: Why raw kernel data isn't useful in Kubernetes (3:30)
The primary finding presented by Macías and Tauri was the unexpected and severe degradation of the Kubernetes API server when Baila was deployed in a large production cluster. What started as a few tens of requests per second to the API server escalated dramatically to over two million requests per second. This unprecedented load caused the API server's error rates to skyrocket from near zero to 10,000 errors per second, leading to significant cluster instability. Beyond the API server itself, the cascading effects impacted other critical Kubernetes components, causing reconciliation failures for various objects and disrupting the normal operation of the cluster.
Users reported that simply enabling Baila in their clusters doubled the memory consumption of the kube-API server. Initially, these reports were met with skepticism, but internal deployments quickly confirmed the severity of the issue. The root cause was identified as the architectural choice to deploy Baila as a DaemonSet, with each instance independently subscribing to the Kubernetes API for cluster-wide metadata updates using the Kubernetes informers Go library.
The informers library, while powerful for maintaining an in-memory cache of Kubernetes objects and watching for updates, operates by retrieving a full snapshot of the cluster state (all pods, nodes, services, etc.) and then subscribing to a continuous stream of updates. When N DaemonSet instances, one per node, each attempt to maintain a complete, up-to-date view of the entire cluster, the API server faces an N^2 scaling problem. Each informer instance needs to know about all pods, not just those on its local node. The Kubernetes API server, in processing these subscriptions, effectively fans out requests to other kubelets to gather comprehensive pod information across the cluster. If there are N nodes, and each node's Baila instance needs to know about pods on all N nodes, the aggregate request load on the API server scales quadratically with the number of nodes. This quadratic complexity, manageable in small clusters, quickly becomes overwhelming in large-scale deployments, leading to resource exhaustion (CPU, memory) and ultimately API server starvation.
Technical Deep Dive
▶ Watch: Initial approach: Tempting Kubernetes API for metadata (4:40)
The original Baila architecture was built on a pipeline model, designed to extract raw eBPF data, transform it, and then enrich it with Kubernetes metadata. Specifically, for network-level metrics, Baila collected source and destination IPs from eBPF. To make these IPs meaningful, they needed to be decorated with Kubernetes metadata such such as pod names, namespaces, service names, and labels.
Each Baila instance, running as a DaemonSet pod on a Kubernetes node, utilized the Kubernetes informers Go library to acquire this metadata. The informers library works in two main phases:
- Initial Snapshot: It first retrieves a complete snapshot of all relevant Kubernetes objects (pods, services, nodes) from the Kubernetes API server. This snapshot contains comprehensive details, including IP addresses, names, namespaces, and labels.
- Watch Mechanism: After the initial snapshot, it establishes a watch connection to the API server, receiving real-time updates whenever a Kubernetes object is created, updated, or deleted.
Baila maintained an in-memory map that correlated IP addresses (and other identifiers like container IDs) with their corresponding Kubernetes metadata. This allowed the pipeline to efficiently look up and decorate metrics as they flowed through the system.
The core of the scaling problem lay in the DaemonSet deployment model combined with the informers' need for cluster-wide state. While a Baila instance running on a specific node could query its local kubelet for information about pods on that node, network metrics often involve communication between pods on different nodes, or between a local pod and an external service. Therefore, each Baila instance needed a complete, global view of all pods and services across the entire cluster.
The speakers clarified the N^2 complexity: when N DaemonSet instances, each running an informer, subscribe to the Kubernetes API, the API server must process N distinct, full-cluster state requests. More subtly, the way the API server aggregates and distributes information from various kubelets to satisfy these broad subscriptions contributed to the quadratic load. For example, if an informer needs pod information, the API server might query each kubelet for its local pods and then aggregate this information. When N informers are doing this simultaneously, the internal fan-out and aggregation within the API server rapidly consume resources. This led to the observed memory doubling and request stampede.
To address this critical issue, several alternative solutions were considered and rejected:
- Individual Requests: Replacing the subscription model with individual API requests was deemed inefficient. The Kubernetes API is not optimized for querying by IP address but rather by name. Moreover, an initial "stampede" of requests would still occur during each DaemonSet instance's startup.
- Local Kubelet API: While the kubelet exposes a local API, it only provides information about pods and resources local to that specific node. It lacks the global context necessary for enriching cross-node network metrics.
- Clustered Cache with Gossip Protocol: Implementing a distributed cache with a gossip protocol to share metadata between Baila instances was considered. However, this would introduce significant complexity, add network traffic, and essentially re-implement a distributed system problem, potentially leading to similar scaling challenges.
The chosen solution was a centralized cache deployment. Instead of embedding the Kubernetes informers code directly into each Baila DaemonSet instance, an external, dedicated set of pods would host this logic. This centralized cache service would:
- Run as a standard Kubernetes deployment (e.g., one or more replicas).
- Be responsible for running the Kubernetes informers Go library and subscribing to the Kubernetes API.
- Maintain a complete, up-to-date snapshot of all necessary Kubernetes metadata for the entire cluster.
This cache service would then expose a lightweight interface for Baila instances to consume metadata. The communication between Baila DaemonSet instances and the centralized cache service was implemented using gRPC streams with a minimal Protobuf definition. This approach significantly reduced the network overhead and resource consumption associated with transferring metadata. The cache instance only stores the minimal needed snapshot of Kubernetes objects (name, namespace, kind, owner, labels, annotations), avoiding the transfer of bulky YAML/JSON objects containing extraneous information.
The result is a two-level cache architecture: the centralized cache service maintains the authoritative cluster state, and each Baila instance maintains its own local, internal database (mapping IPs to metadata) by subscribing to the gRPC stream from the cache service. This design effectively isolates the high-load informer logic to a few dedicated pods, dramatically reducing the burden on the Kubernetes API server from an N^2 problem to a much more manageable O(1) or O(replicas) problem.
The centralized cache was designed to be stateless in its persistent storage; it doesn't require an external database or message queue. If a cache pod crashes, a new one starts, reloads the snapshot from the API, and Baila instances reconnect. While Baila might temporarily miss a few updates during this brief restart, its local cache ensures most metrics can still be decorated, minimizing impact.
Demo / Proof of Concept
▶ Watch: Kubernetes Informers: How metadata enrichment works (6:30)
While the talk did not feature a live, interactive demo, the speakers presented compelling evidence and diagnostic data to illustrate both the problem and the effectiveness of their solution. They showed performance graphs depicting the dramatic increase in Kubernetes API server requests (from tens to over two million per second) and error rates (from zero to 10,000 per second) during the initial problematic deployment.
Crucially, they used Pyroscope profiles to dive into the resource utilization of the cache service during startup. These profiles clearly demonstrated that during the first minute or so of the cache pod's lifecycle, resource utilization (CPU and memory) was almost double its steady-state. This spike was attributed primarily to the deserialization of the large initial Kubernetes API snapshot and subsequent serialization when serving requests to the DaemonSet.
To mitigate this startup overhead, two key optimizations were highlighted:
- Minimal Data Storage: The cache instance was optimized to store only the specific, configured metadata required for decoration, rather than the entire Kubernetes object. This reduced the memory footprint.
- gRPC Subscription for Clients: On the client (Baila DaemonSet) side, the communication with the cache was switched to a gRPC subscription, using binary encodings. This significantly reduced memory utilization and CPU overhead associated with serialization and deserialization compared to JSON or other text-based formats.
These diagnostic insights and the subsequent improvements demonstrated a thorough understanding of the performance bottlenecks and the efficacy of the centralized cache approach.
Defensive Implications
▶ Watch: Crushing the Kubernetes API: 2M requests/sec (8:50)
The experience shared by Grafana Labs offers crucial defensive implications for anyone operating or developing within Kubernetes:
- Strategic API Interaction for DaemonSets: Developers should be acutely aware of the performance implications when designing DaemonSets that interact with the Kubernetes API, especially when needing cluster-wide state. A DaemonSet, by nature, scales with the number of nodes, and if each instance independently queries the API for global information, the load can quickly become quadratic (
N^2) or worse, leading to API server starvation. The centralized cache pattern presented is a robust defense against this specific scaling anti-pattern. - Capacity Planning for Downstream Dependencies: When planning resource requests and limits for Kubernetes deployments, particularly DaemonSets, it's not enough to consider only the computational complexity of the application itself. Operators must also account for the downstream impact on shared infrastructure like the Kubernetes API server. Adequate headroom must be provisioned for components that might experience transient spikes in resource utilization, such as during startup or re-synchronization events (e.g., the cache's startup memory doubling).
- Monitor Kubernetes API Server Health: Proactive monitoring of the Kubernetes API server's request rates, error rates, latency, and resource consumption (CPU, memory) is paramount. Early detection of anomalies in these metrics can signal impending issues before they escalate into full-blown cluster outages.
- Leverage Centralized Caching for Global State: For applications requiring a consistent, cluster-wide view of Kubernetes objects (e.g., for observability, policy enforcement, or scheduling), consider implementing a dedicated, centralized caching service. This service can subscribe to the Kubernetes API once (or a few times, for redundancy) and then serve lightweight, filtered metadata to numerous clients via efficient protocols like gRPC. The
bail-cachecomponent developed by Grafana Labs is an example of such a service, and the speakers highlighted its potential usefulness for other teams facing similar API starvation problems, even outside of Baila. - Optimize Data Transfer and Storage: When dealing with large volumes of Kubernetes metadata, optimize the data transferred and stored. Only retain the absolutely necessary fields and use efficient binary serialization formats like Protobuf over gRPC, rather than full JSON/YAML objects over REST, to minimize network bandwidth, memory consumption, and CPU cycles for serialization/deserialization.
- Understand Informer Behavior: Developers using Kubernetes informers should understand that they maintain a full in-memory cache and watch for updates. While efficient for a single controller, deploying many independent informers, each needing global state, can collectively overwhelm the API server.
Key Takeaways
- DaemonSets + Kubernetes Informers can be an Anti-Pattern at Scale: Deploying a DaemonSet where each instance runs a Kubernetes informer for cluster-wide metadata leads to an
N^2scaling problem that can overwhelm the Kubernetes API server in large clusters. - Centralized Cache is a Scalable Solution: A dedicated, centralized cache service that subscribes to the Kubernetes API once and then distributes minimal, relevant metadata to DaemonSet instances via efficient binary protocols (like gRPC/Protobuf) effectively mitigates API server load.
- Capacity Planning Must Include Downstream Impact: When sizing Kubernetes deployments, especially DaemonSets, always consider the potential impact on shared infrastructure like the Kubernetes API. Leave sufficient headroom for transient resource spikes during startup or re-synchronization.
- Optimize Data Transfer and Storage: Reduce overhead by storing only essential metadata and using efficient binary serialization (e.g., Protobuf) for communication between components, particularly when dealing with high-volume data streams.
- Monitor API Server Health Closely: Proactive monitoring of Kubernetes API server request rates, error rates, and resource utilization is critical for early detection of performance bottlenecks.
- The Problem is Common, Solution is Reusable: The issue of Kubernetes API starvation due to informer use is not unique to Baila; the centralized cache pattern can be applied to other Kubernetes applications facing similar challenges.
About the Speaker(s)
Terra Tauri is a Staff Software Engineer at Grafana Labs. In her role, she focuses on developing and enhancing observability tools, particularly those leveraging eBPF technology. Her work involves tackling complex distributed systems challenges within Kubernetes environments, as demonstrated by her in-depth understanding of the issues surrounding Kubernetes API interactions and performance at scale.
Mario Macías is also a Staff Software Engineer at Grafana Labs. He is a key contributor to eBPF-based projects and possesses deep expertise in eBPF internals and its application for network monitoring and security within Kubernetes. Mario's work, including a separate, more detailed talk on eBPF, highlights his proficiency in low-level kernel interactions and their integration into cloud-native observability platforms. Together, their combined expertise provided a comprehensive perspective on the technical challenges and solutions discussed in the talk.
Reviews
Dr. Zero (Offensive Security Researcher) — MUST SEE
This talk by Macías and Tauri from Grafana Labs dissects a critical Kubernetes anti-pattern: DaemonSets using informers for cluster-wide state, leading to catastrophic API server overload. They provide a brutal, clear diagnosis of the N^2 scaling problem and present an elegant, highly actionable solution using a centralized gRPC-based cache. This isn't just theory; it's a hard-won lesson in distributed systems design, crucial for anyone operating Kubernetes at scale.
Heather Calloway (CISO) — STRONG ACCEPT
This talk meticulously dissects a critical architectural misstep in large-scale Kubernetes deployments: the use of DaemonSets with Kubernetes informers for cluster-wide metadata. Macías and Tauri compellingly demonstrate how this anti-pattern can lead to catastrophic API server collapse, presenting detailed diagnostic evidence and a robust, centralized caching solution. The insights are invaluable for any organization operating Kubernetes at scale, particularly those deploying observability or security tools, providing a clear architectural blueprint to mitigate significant infrastructure resilience risks.