Logs, Metrics, Traces and Mayhem: An Interactive Observability Adventure... Jay Clifford & Tom Glenn
Jay Clifford, Tom Glenn
KubeCon + CloudNativeCon Europe 2025 · Session
Overview
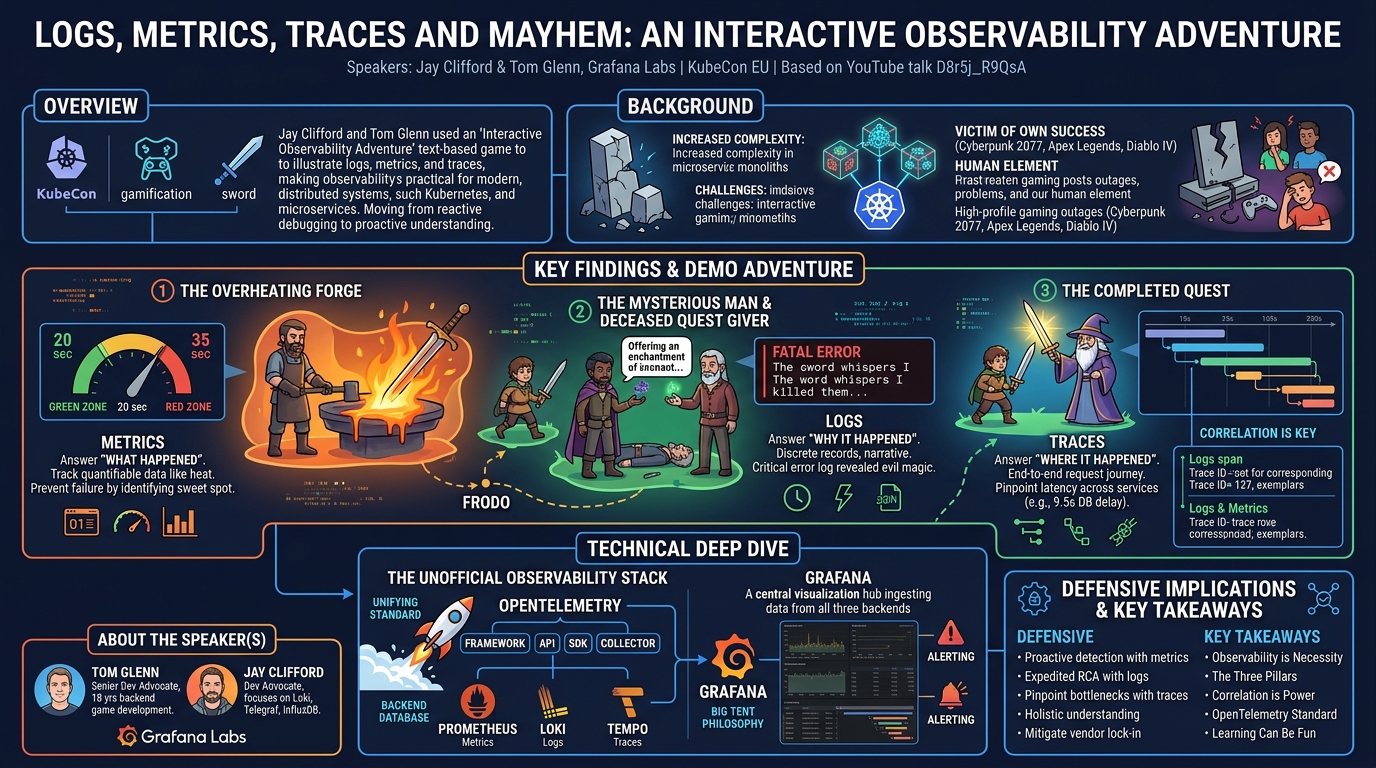
In an engaging and unconventional KubeCon EU session, Jay Clifford and Tom Glenn, Developer Advocates at Grafana Labs, took attendees on an "Interactive Observability Adventure." This talk distinguished itself by gamifying the often-complex world of system monitoring and debugging, using a text-based adventure game to illustrate core observability principles. The central theme revolved around the three pillars of observability—logs, metrics, and traces—and how their combined power is indispensable for understanding and troubleshooting modern, distributed systems.
Logs, Metrics, Traces and Mayhem: An Interactive Observability Adventure... Jay Clifford & Tom Glenn
Speakers: Jay Clifford, Senior Developer Advocate, Grafana Labs; Tom Glenn, Developer Advocate, Grafana Labs
Conference: KubeCon EU
YouTube: https://www.youtube.com/watch?v=D8r5j_R9QsA
Overview
In an engaging and unconventional KubeCon EU session, Jay Clifford and Tom Glenn, Developer Advocates at Grafana Labs, took attendees on an "Interactive Observability Adventure." This talk distinguished itself by gamifying the often-complex world of system monitoring and debugging, using a text-based adventure game to illustrate core observability principles. The central theme revolved around the three pillars of observability—logs, metrics, and traces—and how their combined power is indispensable for understanding and troubleshooting modern, distributed systems.
The speakers aimed to demystify observability, moving beyond theoretical concepts to practical, relatable scenarios within the game. By presenting common operational challenges, such as unexpected system behavior, performance bottlenecks, and critical failures, they demonstrated how each telemetry signal provides a unique lens into a system's internal state. The talk underscored the critical shift from reactive debugging to proactive system understanding, advocating for observability as a fundamental requirement rather than a luxury in today's intricate software landscapes.
This presentation holds significant relevance for anyone involved in building, deploying, or maintaining applications in cloud-native environments, particularly those leveraging microservices and Kubernetes. It highlights the inherent complexities introduced by distributed architectures and offers a clear, practical pathway to gaining comprehensive insights into system health and performance. The interactive approach serves as a powerful testament to the idea that learning and implementing robust observability practices can be both effective and enjoyable, ultimately leading to more resilient and performant applications.
Background
The evolution of software architectures, particularly the widespread adoption of microservices and platforms like Kubernetes, has introduced unprecedented levels of complexity into system operations. As Jay Clifford articulated, while microservices offer benefits like scalability and independent deployment, they transform problems from localized issues within a monolithic application into opaque failures distributed across potentially hundreds of interconnected services. This architectural shift means that traditional debugging methods, often relying on simple "print statements," are no longer sufficient to pinpoint the root cause of issues in a timely manner.
Tom Glenn highlighted several high-profile examples of this complexity leading to significant outages and performance problems in well-known games. Cyberpunk 2077 faced massive performance issues and bugs upon its initial release, particularly on last-generation consoles, rendering it "broken" for many users. Apex Legends experienced a complete outage for an entire weekend due to matchmaking database issues, preventing access for 48 hours. Similarly, Diablo IV struggled with login and scaling problems at launch, unable to handle the sheer volume of concurrent users. These instances underscore the severe impact that a lack of comprehensive observability can have on user experience, reputation, and revenue.
Clifford further distilled the reasons for these failures into three main categories:
- Complexity: The distributed nature of microservices makes it challenging to trace failures across numerous interconnected components. As systems scale to thousands of pods communicating with one another, identifying the exact point of failure becomes increasingly difficult.
- Victim of Own Success: Solutions that work perfectly for a small user base (e.g., 10 customers) often buckle under the pressure of scaling to a much larger audience (e.g., 10,000 customers). This exposes bottlenecks, edge cases, and hardware capacity limitations that were not apparent at lower loads.
- Human Element: Despite best efforts, bad code, faulty package updates, or unexpected user behavior ("users do user things") are inevitable. Systems must be designed with the capacity to quickly identify and mitigate issues arising from these human factors, rather than being caught off guard.
These challenges necessitate a robust observability strategy, moving beyond basic monitoring to a holistic approach that provides deep insights into the "black box" of modern applications.
Key Findings
The talk's primary contribution was its clear and interactive demonstration of how the three pillars of observability—metrics, logs, and traces—work in concert to provide a comprehensive understanding of system behavior. The speakers effectively illustrated that each telemetry signal answers a distinct but complementary question, and their correlation is paramount for effective debugging and operational excellence.
- Metrics Answer "What Happened": Metrics provide quantifiable, time-series data points that reveal the state and performance of a system. They are crucial for identifying when something went wrong or if a system component is behaving outside normal parameters (e.g., a forge overheating, a service's CPU utilization spiking). By tracking specific values over time, metrics enable proactive monitoring and early detection of anomalies.
- Logs Answer "Why It Happened": Logs are event records that capture discrete messages about what occurred within an application at a specific point in time. They offer the narrative, detailing why a particular event transpired. In the demo, a critical log entry revealed that an "evil sword" was responsible for the quest giver's demise, providing the specific reason for the unexpected system state. Logs, especially structured logs with rich metadata, are indispensable for root cause analysis.
- Traces Answer "Where It Happened": Traces map the end-to-end journey of a request or operation through a distributed system. Composed of spans (individual operations within the request), traces precisely pinpoint where latency or errors are introduced. This allows engineers to identify bottlenecks across multiple services, even in complex microservice architectures, such as the 9.5-second delay in a matchmaking database query shown in a Diablo IV example.
- Correlation is Key: The true power of observability emerges when these three signals are correlated. The talk vividly demonstrated how a trace ID could link a specific user action (e.g., accepting a quest) to the relevant logs (e.g., the "evil sword" message) and metrics (e.g., the "evil sword" count). This correlation, especially through concepts like exemplars (linking metrics to traces), allows engineers to jump seamlessly between different views of the system, transforming a fragmented understanding into a cohesive narrative of system behavior.
- OpenTelemetry as the Unifying Standard: The talk highlighted OpenTelemetry as a critical, vendor-neutral standard for instrumenting applications and collecting all three telemetry types. Its framework, API, SDKs, and collector provide a consistent way to generate, process, and export observability data, effectively mitigating vendor lock-in and promoting interoperability across diverse observability backends.
- Observability is a Necessity, Not a Luxury: The speakers emphasized that in today's highly demanding digital landscape, where users expect near-perfect availability and performance (e.g., Netflix, Amazon), robust observability is non-negotiable. It's essential for maintaining Service Level Objectives (SLOs) and ensuring the reliability of critical systems.
- Learning Can Be Fun: Perhaps the most unique finding was the demonstration that complex technical concepts like observability can be taught through engaging, interactive methods. The text-based adventure game proved that hands-on, problem-solving scenarios, even in a simulated environment, can significantly enhance learning and retention.
Technical Deep Dive
The interactive adventure game, while light-hearted, was built upon a sophisticated and modern observability stack, demonstrating practical application of key technologies. The core architecture involved a Python script instrumented with OpenTelemetry, an OpenTelemetry Collector, and a suite of Grafana Labs' open-source backend databases: Prometheus for metrics, Loki for logs, and Tempo for traces, all visualized through Grafana.
The Three Pillars of Observability
- Metrics: As the "what happened" signal, metrics are quantifiable pieces of data, typically time-series, with a unique name and associated label key-value pairs. These labels allow for rich segmentation and filtering of metric data (e.g., differentiating between various queues). Common metric types include:
- Counters: Monotonically increasing values (e.g., total requests served).
- Gauges: Arbitrary values that can go up or down (e.g., current CPU usage, forge heat).
- Histograms: Sample observations and count them in configurable buckets, providing statistical distribution (e.g., request latencies).
Metrics are crucial for dashboards, alerting, and understanding system trends over time.
- Logs: Referred to as the "OG telemetry type," logs answer "why it happened." They are discrete, immutable records of events within a system. While historically simple "print statements" or console outputs, modern logging has evolved to include structured formats like JSON and XML, or network-based protocols like Syslog and OTLP. Key components of a log entry typically include:
- Timestamp: When the event occurred.
- Severity: The criticality of the event (e.g.,
EMERGENCY,WARNING,INFO,DEBUG). - Message: A human-readable description of the event.
- Metadata: Additional contextual information (e.g., host, service name, request ID).
Logs are essential for detailed debugging and forensic analysis, providing the narrative behind system behavior.
- Traces: Representing the "where it happened," traces visualize the end-to-end journey of a single request or operation as it propagates through a distributed system. A trace is composed of a series of spans, where each span represents a specific action or operation taken within a service (e.g., a function call, a database query, an RPC call). Each span has a start and end time, parent-child relationships, and associated attributes. Traces are invaluable for:
- Pinpointing latency bottlenecks across multiple services.
- Understanding dependencies between microservices.
- Debugging distributed transaction failures.
The example of a matchmaking API connecting to a database, showing a 9.5-second delay in the database query, clearly illustrated the power of traces in identifying performance issues.
OpenTelemetry: The Unifying Standard
A cornerstone of the demo's architecture was OpenTelemetry (OTel), described as the child of OpenCensus (for metrics) and OpenTracing (for tracing). OTel unifies the collection of metrics, logs, and traces, and is expanding to include continuous profiles. It acts as a comprehensive standard, comprising:
- Framework: A conceptual model for telemetry data.
- API: Language-specific interfaces for instrumenting applications.
- SDK: Implementations of the API for various programming languages (e.g., Python SDK used in the demo).
- Collector: A vendor-agnostic agent for processing and exporting telemetry data.
The OpenTelemetry Collector is a critical component that receives, processes, and distributes OpenTelemetry signals. It operates primarily using the OTLP (OpenTelemetry Protocol) format, which is the native data format designed by OpenTelemetry. However, the collector is highly extensible and can convert OTLP data to various third-party formats, ensuring compatibility with diverse backend systems. The preference is for data sources to have an OTLP endpoint, allowing direct ingestion of native OTLP data without transformation.
Telemetry Storage and Visualization
The collected telemetry data was stored in a suite of specialized open-source databases, each optimized for a specific data type:
- Prometheus: The metric store, utilizing its powerful query language, PromQL. In the demo, PromQL was used to query for the "forge heat" gauge and the "evil sword" counter, enabling real-time monitoring and alerting.
- Loki: The log store, leveraging LogQL, a query language heavily inspired by PromQL. Loki was instrumental in searching for specific log entries, such as the "fatal error" message indicating the sword's malevolent actions.
- Tempo: The trace store, employing TraceQL, also heavily inspired by PromQL. Tempo stored the full trace of the adventure game, allowing the speakers to visualize the sequence and duration of each span.
Crucially, all three of these Grafana Labs projects (Prometheus, Loki, Tempo) offer native OTLP endpoints. This direct ingestion capability simplifies the architecture by eliminating the need for complex data transformations between the OpenTelemetry Collector and the storage backends.
Finally, Grafana served as the open-source observability platform for visualizing, monitoring, and analyzing all this data. Grafana's "big tent philosophy" emphasizes its ability to ingest and display data from virtually any source, providing a unified dashboard experience. It allowed the speakers to create panels for the forge heat gauge, a log panel to display game events, and a trace view to show the adventure's progression. Grafana also supports robust alerting, which could have notified the adventurers if the forge got too hot or if an "evil sword" was acquired.
The entire setup, from Python script instrumentation to data visualization, showcased a complete, modern observability pipeline that is both powerful and flexible.
Demo / Proof of Concept
The heart of the talk was an interactive, text-based adventure game designed to simulate real-world debugging scenarios using observability tools. The audience participated by guiding "Frodo" (Tom Glenn's chosen character name) through a quest to defeat an evil wizard.
The Adventure's Challenges and Observability Solutions
- The Overheating Forge (Metrics in Action):
- Problem: Early in the quest, Frodo needed a sword forged by the blacksmith. The process required heating the forge, but without guidance, the player didn't know how long to heat it. Heating for too long (35 seconds) caused the sword to melt and the blacksmith's forge to "burn down," making it impossible to request another sword.
- Observability Solution: After rebuilding the blacksmith (a simulated system recovery), the adventurers noticed a forge heat gauge on their Grafana dashboard. This gauge, representing a metric, provided real-time feedback on the forge's temperature. By monitoring this gauge, they could identify the "sweet spot" (the green zone) and request the sword at the optimal time (around 20 seconds), successfully obtaining a sword without overheating the forge. This demonstrated how metrics provide crucial "what happened" information, allowing for proactive adjustment and preventing system failures.
- The Mysterious Man and the Deceased Quest Giver (Logs for Root Cause):
- Problem: With a sword in hand, Frodo encountered a "mysterious man" who offered to enchant the sword. Accepting this offer resulted in the quest giver immediately collapsing dead upon Frodo's return, preventing the acceptance of the quest. The game offered no immediate explanation for this bizarre event.
- Observability Solution: The speakers then turned to their Grafana dashboard, specifically the logs panel. Filtering through the log entries, they quickly found a critical error (later identified as a fatal error) stating: "The sword whispers I killed them. You'll never destroy the wizard with me in your hands." This log entry provided the explicit "why it happened," revealing that the mysterious man had imbued the sword with dark magic, making it "evil" and causing the quest giver's demise. This demonstrated the power of logs for detailed root cause analysis.
- Resolution: To progress, Frodo visited the chapel, where a priest blessed the sword, transforming it into a "holy sword." With the curse lifted, the quest giver (or rather, a "third generation of quest giver") was able to accept the quest.
Correlating Telemetry Signals
The demo truly shone in its demonstration of correlating metrics, logs, and traces:
- Traces for End-to-End Journey: After completing the adventure, the Grafana dashboard displayed a trace of the entire game session. Each action taken by Frodo (e.g.,
go to town,request sword,heat forge,accept offer) was represented as a span, showing its duration and sequence. This provided an overall view of "where" Frodo spent his time and the flow of the adventure, with the total time of 8 minutes and 27 seconds serving as a performance metric for the game session.
- Trace-to-Log Correlation: By clicking on a specific span within the trace (e.g., the
accept his offerspan where the mysterious man enchanted the sword), the dashboard automatically filtered the logs to show entries relevant to that specific action. This immediately surfaced the "evil wizard enchanted your sword with dark magic" warning log, demonstrating how traces can pinpoint the exact time and context for relevant log messages. This seamless correlation helps answer "where did it happen" and "why did it happen" simultaneously.
- Exemplars: Metrics to Traces: The demo also briefly touched upon exemplars, which link specific metric data points to corresponding trace IDs. For instance, on the sword timeline metric (which indicated whether the sword was "holy" or "evil"), clicking on a specific data point would directly jump to the trace ID for the game session where that sword state was achieved. This illustrates how exemplars bridge the gap between "what happened" (the metric value) and "where it happened" (the specific trace responsible for that value).
The demo successfully illustrated how a combination of metrics, logs, and traces, when correlated, provides a holistic and actionable view of a system, enabling rapid identification and resolution of complex issues.
Defensive Implications
The insights gleaned from this interactive observability adventure have profound implications for defenders, including Site Reliability Engineers (SREs), DevOps teams, and security engineers. Implementing a robust observability strategy, as demonstrated, moves organizations from reactive firefighting to proactive system management and rapid incident response.
- Proactive Anomaly Detection with Metrics: Defenders should prioritize comprehensive metrics collection across all critical system components. By monitoring key performance indicators (KPIs) like CPU utilization, memory consumption, request latency, error rates, and custom application-specific gauges (like the "forge heat"), SREs can establish baselines and detect anomalies early. Setting up Grafana alerts on these metrics allows teams to be notified immediately when thresholds are breached (e.g., forge heat too high, error rate spiking), preventing minor issues from escalating into major outages.
- Expedited Root Cause Analysis with Logs: Structured and centralized logging is indispensable for understanding why an incident occurred. Defenders should ensure that applications emit rich, contextual logs with appropriate severity levels. Centralizing these logs in a system like Loki and leveraging powerful query languages like LogQL allows for rapid searching and filtering during an incident. The demo's "evil sword" log entry perfectly illustrates how specific, detailed log messages are crucial for pinpointing the exact cause of an unexpected system behavior, drastically reducing mean time to resolution (MTTR).
- Pinpointing Performance Bottlenecks with Traces: In complex microservice environments, traces are critical for identifying where latency is introduced or errors originate across distributed services. By instrumenting applications with OpenTelemetry, defenders can visualize the full request flow, identifying slow spans or failing services. Tools like Tempo enable SREs to quickly drill down into specific problematic interactions, such as a database query causing a 9.5-second delay, which might be invisible without end-to-end tracing. This is vital for optimizing performance and ensuring service responsiveness.
- Holistic System Understanding through Correlation: The most powerful defensive posture comes from correlating metrics, logs, and traces. Defenders should leverage platforms like Grafana that facilitate seamless navigation between these telemetry signals. When an alert fires (metric), the ability to jump directly to the relevant trace and then to specific log entries for that trace provides a complete picture of "what happened," "where it happened," and "why it happened." This integrated view is crucial for understanding complex interactions and interdependencies in distributed systems.
- Mitigating Vendor Lock-in with OpenTelemetry: Adopting OpenTelemetry as a standard for instrumentation is a strategic defensive move. It provides vendor neutrality, allowing organizations to switch observability backends (e.g., from one metrics store to another) without re-instrumenting their applications. This flexibility reduces the risk of vendor lock-in, ensures future adaptability, and empowers teams to choose the best tools for their specific needs and budget.
- Establishing SLOs and Error Budgets: Observability data directly feeds into the definition and monitoring of Service Level Objectives (SLOs) and Error Budgets. By continuously collecting and analyzing metrics, logs, and traces, defenders can accurately measure system reliability and performance against defined targets. This data-driven approach allows teams to make informed decisions about feature development versus reliability work, ensuring that user expectations for system uptime and performance are consistently met.
- Leveraging Community Knowledge: The speakers also encouraged participation in observability communities, such as the Grafana community forum. This fosters knowledge sharing among like-minded individuals, allowing defenders to learn from others' experiences, seek help for complex challenges, and contribute their own solutions, further strengthening collective defensive capabilities.
Key Takeaways
- Observability is a Necessity, Not a Luxury: In today's demanding digital landscape, comprehensive observability is crucial for maintaining system reliability, meeting user expectations, and preventing costly outages in complex, distributed systems.
- The Three Pillars: What, Why, Where: Metrics tell you "what happened," logs explain "why it happened," and traces reveal "where it happened." Understanding and leveraging each signal is fundamental.
- Correlation is Power: The true strength of observability comes from correlating metrics, logs, and traces (e.g., via trace IDs and exemplars) to gain a holistic and actionable view of system behavior and quickly pinpoint root causes.
- OpenTelemetry for Vendor Neutrality: Adopt OpenTelemetry as the standard for instrumentation to avoid vendor lock-in, unify telemetry collection, and ensure flexibility in choosing observability backends.
- Learning Can Be Fun: Engaging, interactive approaches, like the text-based adventure game, can make learning complex observability concepts more accessible and enjoyable for engineers.
- Grafana's Big Tent Philosophy: Platforms like Grafana enable visualization and analysis of data from diverse sources, promoting an open and integrated observability ecosystem.
About the Speaker(s)
Tom Glenn is a Senior Developer Advocate for Grafana Labs. With 18 years of experience as a software engineer, Tom's professional background is predominantly in backend game development. He also maintains his passion as a hobbyist game developer, bringing a unique and engaging perspective to technical discussions like this observability adventure.
Jay Clifford is also a Developer Advocate at Grafana Labs. His work at Grafana Labs primarily focuses on Loki, Grafana's log aggregation database, where he contributes to documentation and educational content. Prior to joining Grafana Labs, Jay worked for InfluxData, gaining experience with Telegraf and InfluxDB, further solidifying his expertise in telemetry and time-series data.
Reviews
Dr. Zero (Offensive Security Researcher) — STRONG ACCEPT
This KubeCon session by Grafana Labs advocates delivered a highly effective, interactive demonstration of core observability principles. While the underlying technologies (metrics, logs, traces, OTel) are established, the gamified, live-demo approach provided a clear, actionable understanding of how these pillars correlate to debug complex distributed systems. It's a masterclass in practical application and teaching, cutting through marketing fluff with real-world (simulated) problem-solving.
Heather Calloway (CISO) — STRONG ACCEPT
This KubeCon session delivered a highly effective and engaging demonstration of core observability principles. While presented in an interactive, almost gamified format, it provided a clear, actionable understanding of how metrics, logs, and traces, when correlated, are indispensable for operational resilience and rapid incident response in complex distributed systems. The direct link to real-world business outages underscored its practical relevance for any leader concerned with system availability and accountability.