Learning Kubernetes Through the Lens of Metrics - Priyanka Saggu & Mario Jason Braganza
Priyanka Saggu, Mario Jason Braganza
KubeCon + CloudNativeCon Europe 2025 · Session
Overview
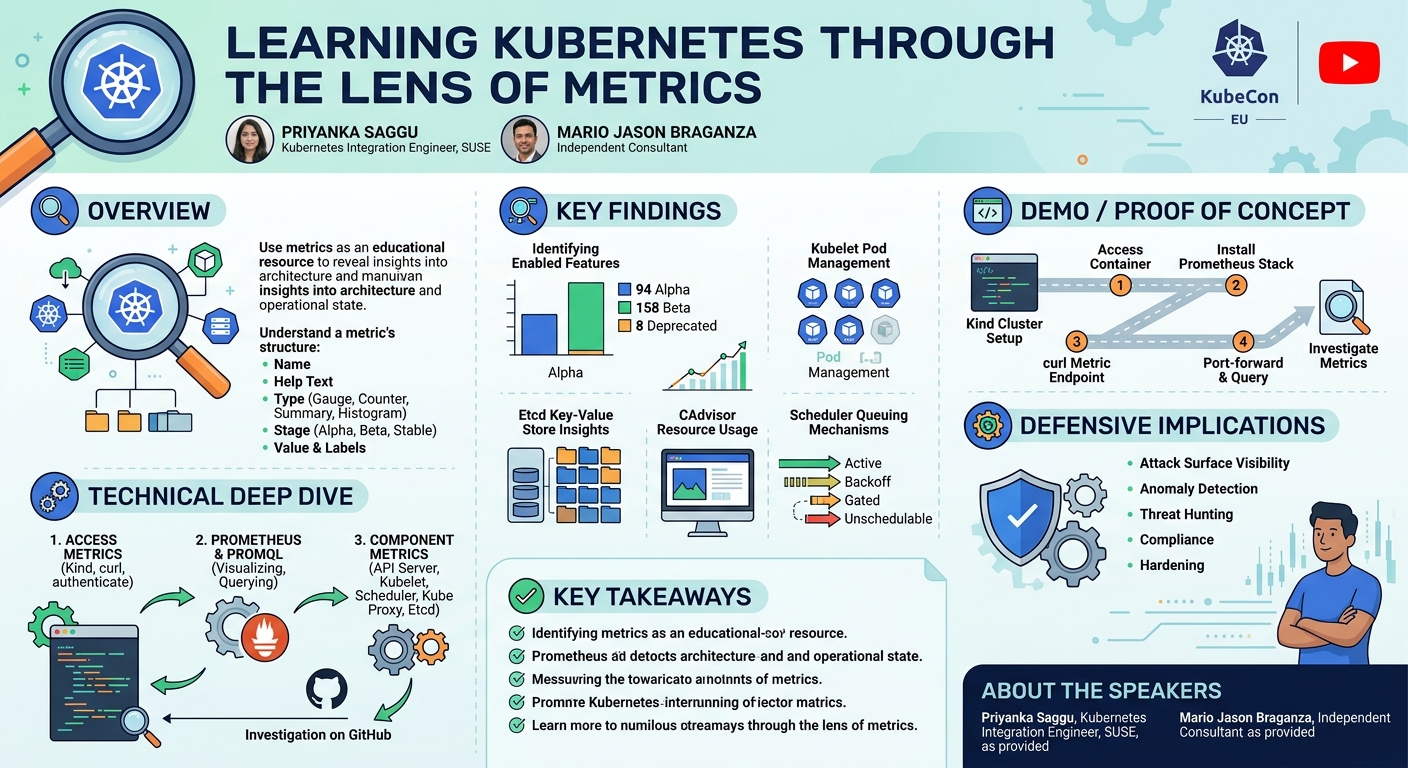
In this insightful KubeCon EU talk, Priyanka Saggu and Mario Jason Braganza presented a unique methodology for understanding the intricate workings of Kubernetes: by dissecting the vast array of metrics it exposes. Titled "Learning Kubernetes Through the Lens of Metrics," their presentation served as a spiritual successor to their previous talk on Kubernetes Enhancement Proposals (KEPs), continuing their exploration of Kubernetes internals through unconventional yet highly effective lenses. The speakers posited that rather than relying solely on documentation or high-level overviews, diving deep into the raw data points generated by Kubernetes components can reveal profound insights into its architecture, operational state, and feature landscape.
Key moments
- 0:00 Introduction and talk overview
- 1:40 What Kubernetes metrics can reveal & the challenge
- 2:22 Understanding Kubernetes metric structure
- 3:38 Example: Kubernetes build info metric
- 4:30 First anecdote: Finding enabled features in a cluster
- 5:30 Accessing metrics from Kind control plane
- 6:50 Identifying the kubernetesfeatureenabled metric
- 8:10 Visualizing metrics with Prometheus and Grafana
Learning Kubernetes Through the Lens of Metrics
Speakers: Priyanka Saggu, Kubernetes Integration Engineer, SUSE; Mario Jason Braganza, Independent Consultant
Conference: KubeCon EU
YouTube: https://www.youtube.com/watch?v=95NNuV-SUdg
Overview
In this insightful KubeCon EU talk, Priyanka Saggu and Mario Jason Braganza presented a unique methodology for understanding the intricate workings of Kubernetes: by dissecting the vast array of metrics it exposes. Titled "Learning Kubernetes Through the Lens of Metrics," their presentation served as a spiritual successor to their previous talk on Kubernetes Enhancement Proposals (KEPs), continuing their exploration of Kubernetes internals through unconventional yet highly effective lenses. The speakers posited that rather than relying solely on documentation or high-level overviews, diving deep into the raw data points generated by Kubernetes components can reveal profound insights into its architecture, operational state, and feature landscape.
The core premise of the talk is that Kubernetes metrics are not merely for monitoring or troubleshooting; they are a rich, often overlooked, educational resource. By systematically exploring these metrics, one can uncover which features are active, how many pods a Kubelet is managing, the state of the scheduler queues, the health of the Etcd data store, and even the underlying Go runtime versions of critical components. This approach moves beyond theoretical understanding, offering a practical, hands-on path to grokking Kubernetes by observing its operational heartbeat.
This article delves into their methodology, key findings, and technical demonstrations, providing a comprehensive look at how metrics can serve as an invaluable guide for anyone seeking to deepen their understanding of Kubernetes. It highlights the specific metrics explored, the tools used, and the profound implications for both learning and defending Kubernetes environments.
Background
▶ Watch: Introduction and talk overview (0:00)
The Kubernetes ecosystem is vast and complex, comprising numerous interconnected components, each with its own set of responsibilities and internal mechanisms. For newcomers and seasoned professionals alike, grasping the full breadth of Kubernetes functionality can be challenging. Traditional learning paths often involve studying documentation, architectural diagrams, or high-level tutorials. However, as Saggu and Braganza highlighted, there is no single "A-Z guide" to comprehensively understand all the metrics Kubernetes exposes, despite their critical role in observability. This gap presents an opportunity: to leverage the metrics themselves as a direct window into the cluster's operational reality.
The problem this talk addresses is the difficulty in gaining a holistic, granular understanding of Kubernetes without wading through extensive source code or dense specifications. Metrics, by their very nature, encapsulate the operational state and internal logic of the components that expose them. By examining what data points a component chooses to expose, and with what labels, one can infer its priorities, its internal state, and even the historical context of its development (e.g., why a specific metric was added). This approach transforms metrics from mere data points into a narrative about the system's behavior.
The speakers introduced the fundamental structure of a Kubernetes metric, which typically comprises four key elements:
- Name: A unique identifier for the metric (e.g.,
kubernetes_build_info). - Help: A descriptive string explaining the metric's purpose and what it measures. This is crucial for understanding its context without external documentation.
- Type: Specifies the nature of the metric, such as gauge (a single numerical value that can go up and down), counter (a cumulative metric that only increases), summary (observes individual events and provides quantiles), histogram (samples observations and counts them in configurable buckets), or untyped.
- Stage: Indicates the maturity level of the metric within Kubernetes development, mirroring the feature gate lifecycle. Stages include alpha, beta, stable, deprecated, hidden (no longer scraped by Prometheus), and deleted. This lifecycle is critical for understanding the stability and long-term reliability of a metric.
- Value and Labels: The actual numerical data point, often accompanied by labels (key-value pairs) that provide additional dimensions and context, allowing for powerful querying and aggregation.
This structured understanding of metrics forms the bedrock of their learning methodology, enabling a systematic exploration of the Kubernetes control plane and its various components.
Key Findings
▶ Watch: Understanding Kubernetes metric structure (2:22)
The talk showcased a series of compelling discoveries, demonstrating how specific Kubernetes metrics can demystify complex cluster behaviors and configurations. These findings were not just theoretical but were actively demonstrated through a live exploration of a kind (Kubernetes in Docker) cluster.
One of the most striking findings was the ability to identify all enabled and disabled Kubernetes features within a cluster using the kubernetes_feature_enabled metric. This single metric provides a comprehensive overview of the cluster's feature gate configuration, distinguishing between alpha, beta, stable, and deprecated features, and indicating their active status. For example, the demo cluster revealed 94 alpha features, 158 beta features, and 8 deprecated features that were enabled.
Another significant insight came from examining Kubelet metrics, specifically kubelet_desired_pods and kube_pod_info. These metrics not only revealed the total number of pods a Kubelet was instructed to run but also differentiated between pods managed directly by the Kubelet (static pods) and those created via the API server. This distinction is fundamental to understanding pod lifecycle management and the Kubelet's role as an agent on each node.
The speakers also highlighted how metrics could expose granular details about system resource usage and component versions. For instance, CAdvisor metrics provided insights into container memory kernel usage and even a "last seen" timestamp for containers, akin to a "WhatsApp last seen" feature. Furthermore, etcd_mvcc_compaction_revision offered a direct view into the Etcd key-value store's compaction process, revealing the last revision at which compaction occurred and the number of keys compacted, which is crucial for understanding the health and efficiency of the cluster's persistent state.
Finally, the exploration of scheduler_pending_pods unveiled the internal queuing mechanisms of the Kubernetes scheduler. Before this, many might assume a single queue for pending pods, but this metric clearly delineated separate queues such as active_queue, backoff_queue, gated_queue, and unschedulable_queue. This discovery provides a deeper appreciation for the scheduler's sophisticated decision-making process. The talk effectively demonstrated that these seemingly small data points collectively offer a profound and practical understanding of Kubernetes internals.
Technical Deep Dive
▶ Watch: First anecdote: Finding enabled features in a cluster (4:30)
The technical deep dive commenced with a practical demonstration of accessing Kubernetes metrics. The speakers utilized a kind (Kubernetes in Docker) cluster as their testing ground, emphasizing its ease of setup for local experimentation. The first step involved identifying the Docker container running the kind control plane and executing commands inside it.
Once inside the container, the process for accessing metrics involved curl commands directed at specific component endpoints. The Kubernetes API server, being the most prominent component, exposes its metrics on port 6443. To authenticate these curl requests, the demonstration leveraged the certificates and keys available within the control plane host, ensuring secure access to the /metrics endpoint. This initial curl command revealed a torrent of raw metric data, necessitating a focused approach to extract meaningful information.
A foundational metric explored was kubernetes_build_info. This metric, a gauge with a constant value of 1, is adorned with numerous labels such as major, minor, gitVersion, gitCommit, goVersion, and platform. It provides immediate insight into the Kubernetes version, the Go compiler used, and the build specifics of the cluster, which is invaluable for version tracking and compatibility checks.
The core of the "feature enablement" finding revolved around the kubernetes_feature_enabled metric. This metric is a gauge that reports 1 if a feature is enabled and 0 if it's available but disabled. Its labels further categorize features by their stage (e.g., alpha, beta, stable, deprecated). To process and visualize this data effectively, the speakers demonstrated installing the Prometheus stack using a Helm chart on the kind cluster. After port-forwarding to the Prometheus dashboard, specific PromQL (Prometheus Query Language) queries were executed. For instance, count by (stage) (kubernetes_feature_enabled{value="1"}) was used to count the number of enabled features across different stages, revealing the 94 alpha, 158 beta, and 8 deprecated features enabled on the demo cluster. Similarly, changing value="1" to value="0" exposed the disabled features, providing a complete picture of the cluster's feature landscape.
Moving to Kubelet, the speakers identified its metrics endpoint on port 10250. Key Kubelet metrics included kubelet_node_name, which simply identifies the node, and more significantly, kubelet_desired_pods. This gauge metric uses a static label (true/false) to distinguish between pods managed directly by the Kubelet (static=true) and those instructed by the API server (static=false). This offers a nuanced view of pod orchestration. The kube_pod_info metric, when queried in Prometheus, provided a wealth of information about running pods, enriched with labels that allowed for detailed filtering and aggregation, ultimately answering the question of how many pods were running on the node.
The talk also touched upon CAdvisor metrics, exposed via the Kubelet. Metrics like c_advisor_version_info provided OS and kernel version details, while container_memory_kernel_usage offered granular insights into kernel memory consumption by containers. A particularly interesting, albeit simple, metric was container_last_seen, which functions like a "last seen" timestamp for containers. Furthermore, the existence of hidden_metrics_total was revealed, indicating metrics that are no longer scraped by Prometheus due to deprecation or removal, highlighting the dynamic nature of Kubernetes' observability surface.
For network-related insights, Kube Proxy metrics were explored on port 10249. Metrics like kube_proxy_iptables_rules_total, labeled by iptables_chain (e.g., filter, nat), provided a count of rules owned by Kube Proxy. A particularly intriguing metric was kube_proxy_iptables_packets_dropped_total. The speaker detailed how she investigated this metric by searching the Kubernetes GitHub repository for its name, tracing it back to the specific pull request that introduced it. This process revealed that the metric was added to track packets dropped due to connection tracking (conntrack) problems, showcasing a powerful method for understanding the "why" behind specific metrics.
The Kubernetes Scheduler also offers critical metrics for understanding pod scheduling. The scheduler_pending_pods metric, in particular, provided granular detail on the state of pods awaiting scheduling. It includes labels like queue with values such as active_queue, backoff_queue, gated_queue, and unschedulable_queue. This metric exposed the complex internal queuing mechanisms of the scheduler, a detail often abstracted away in high-level discussions.
Finally, the talk delved into Etcd metrics, accessed on port 2379. Etcd, as the key-value store for all Kubernetes cluster data, exposes metrics vital for its health and performance. etcd_cluster_version verified the Etcd version (e.g., v3), while metrics like etcd_server_go_info provided the Go version used to compile Etcd, essential for understanding the runtime environment. Critical for data management was etcd_mvcc_compaction_revision, which tracks the last revision number where a compaction occurred, and etcd_mvcc_compaction_keys_total, indicating the number of keys compacted. These metrics are crucial for monitoring Etcd's long-term stability and preventing data bloat. Additionally, general Go runtime metrics like go_threads were accessible, providing insights into the number of OS threads utilized by Kubernetes components.
Throughout this deep dive, the speakers emphasized that each metric, with its help text and labels, serves as a breadcrumb trail, inviting further investigation into the underlying Kubernetes code and design choices.
Demo / Proof of Concept
▶ Watch: Accessing metrics from Kind control plane (5:30)
The entire technical exposition of the talk functioned as a live, interactive proof of concept, demonstrating how to "learn Kubernetes through the lens of metrics." The speakers systematically walked the audience through the process, starting with a clean slate:
- Kind Cluster Setup: A
kindcluster was initiated, serving as a lightweight, disposable Kubernetes environment for the demonstration. This choice highlighted the accessibility of the methodology for anyone with Docker installed. - Container Access: Using
docker psto identify thekindcontrol plane container, the speakers then useddocker exec -it <container_id> bashto gain shell access to the control plane host. This was a critical step as it allowed direct access to the component endpoints and their necessary authentication artifacts (certificates and keys). - API Server Metrics Retrieval: The first target was the Kubernetes API server, identified as running on port
6443. Acurlcommand was executed againsthttps://localhost:6443/metrics, incorporating theclient.crtandclient.keyfor authentication. The raw output ofkubernetes_feature_enabledwas showcased, illustrating howvalue=1indicated an enabled feature andvalue=0a disabled one, along with their respective stages. - Prometheus Integration and Querying: To move beyond raw
curloutput, the demonstration proceeded to install the Prometheus stack using a Helm chart. This involved commands to add the Prometheus community Helm repository, update it, and install thekube-prometheus-stack. After installation,kubectl port-forwardwas used to expose the Prometheus dashboard locally. Within the Prometheus UI, specific PromQL queries were run, such ascount by (stage) (kubernetes_feature_enabled{value="1"}), which visually aggregated the enabled features by stage (alpha, beta, deprecated). - Component-Specific Metric Exploration: The pattern established for the API server and feature flags was then replicated for other core components:
- Kubelet: Identified on port
10250,curlrequests revealedkubelet_desired_podsandkube_pod_info, demonstrating how to discern static pods from API server-managed ones. Prometheus was again utilized to querykube_pod_infofor aggregated pod counts. - CAdvisor: Accessible via the Kubelet endpoint,
c_advisor_version_infoandcontainer_memory_kernel_usagewere demonstrated, showcasing host and container-level resource insights. - Kube Proxy: Found on port
10249, metrics likekube_proxy_iptables_rules_totalprovided visibility into network rule configuration. The speaker vividly described her investigative process forkube_proxy_iptables_packets_dropped_total, highlighting how metric names can lead to discovering underlying issues and their solutions in the Kubernetes codebase. - Scheduler: The
scheduler_pending_podsmetric was queried, illustrating the different internal queues (active, backoff, gated, unschedulable) that pods traverse before being scheduled. - Etcd: On port
2379,etcd_mvcc_compaction_revisionandetcd_cluster_versionwere shown, providing crucial insights into the cluster's data store health and versioning.
- Investigative Methodology: A key part of the demo was not just showing metrics but how to learn from them. The speaker's explanation of tracing a metric's origin in the Kubernetes GitHub repository (searching for the metric name, finding the code path, and then the PR) was a powerful practical lesson in incident response and system understanding.
The entire sequence served as a compelling, step-by-step guide, proving that with readily available tools and a structured approach, anyone can leverage Kubernetes metrics for deep learning and operational understanding.
Defensive Implications
▶ Watch: Visualizing metrics with Prometheus and Grafana (8:10)
Understanding Kubernetes through its metrics provides powerful defensive implications, enabling security professionals and operators to gain unparalleled visibility and control over their clusters.
- Attack Surface Visibility: The
kubernetes_feature_enabledmetric is a goldmine for understanding the cluster's active attack surface. Knowing precisely which alpha, beta, or even deprecated features are enabled allows defenders to prioritize their security assessments, identify potential vulnerabilities associated with experimental features, and ensure that security configurations align with the cluster's actual capabilities. If a CVE is announced for a specific feature, knowing whether that feature is actively enabled (and not just present) is critical for rapid response.
- Anomaly Detection and Threat Hunting: Metrics like
kubelet_desired_podsandkube_pod_infocan help detect unauthorized pod deployments or deviations from expected pod counts. Sudden spikes inscheduler_pending_podsfor theunschedulable_queuecould indicate resource exhaustion, misconfiguration, or even a denial-of-service attempt. Anomalies inkube_proxy_iptables_rules_totalorkube_proxy_iptables_packets_dropped_totalcould signal network misconfigurations, potential network-level attacks, or attempts to bypass network policies. Monitoringetcd_mvcc_compaction_revisionandetcd_mvcc_compaction_keys_totalcan reveal issues with the cluster's foundational data store, which could be indicative of performance problems or even data corruption attempts.
- Compliance and Auditing: Metrics provide verifiable data points for compliance audits. For instance,
kubernetes_build_infooffers concrete evidence of the Kubernetes version, Go version, and Git commit, which can be cross-referenced against security baselines. Thehidden_metrics_totalmetric can highlight the presence of deprecated features or components that might need to be explicitly disabled or removed to meet compliance standards.
- Proactive Troubleshooting and Incident Response: By understanding the metrics, defenders can proactively identify and mitigate issues before they escalate into security incidents. For example, consistently high
container_memory_kernel_usagecould point to memory leaks in critical security agents, whilecontainer_last_seencould help in post-mortem analysis to determine when a compromised container was last active. The ability to trace the origin of a metric (as demonstrated withkube_proxy_iptables_packets_dropped_total) empowers incident responders to quickly understand the context and potential impact of an observed anomaly.
- Hardening and Configuration Validation: Metrics can validate the effectiveness of hardening efforts. If a security control relies on a specific Kubernetes feature being disabled,
kubernetes_feature_enabledcan confirm its inactive status. Similarly, monitoring component-specific Go versions (etcd_server_go_info) ensures that crucial infrastructure components are running on supported and patched runtimes, mitigating risks from known vulnerabilities in older Go versions.
In essence, adopting a "metrics-first" approach transforms Kubernetes observability from a reactive troubleshooting tool into a proactive defensive mechanism, providing the granular insights necessary to secure and maintain robust cloud-native environments.
Key Takeaways
- Metrics as a Learning Tool: Kubernetes metrics offer a unique and powerful lens for understanding the intricate internal workings of the cluster, revealing details about components, features, and operational states that are often abstracted away.
- Granular Feature Visibility: The
kubernetes_feature_enabledmetric provides comprehensive insight into which alpha, beta, stable, and deprecated features are active or inactive in a cluster, crucial for security assessments and configuration validation. - Deep Component Insights: Specific metrics expose the internal logic of components like Kubelet (pod management, static vs. API server pods), Scheduler (multiple pending pod queues), Kube Proxy (network rules, packet drops), and Etcd (compaction, versioning).
- Practical Investigation Methodology: By starting with a metric's name and help text, one can leverage tools like
curland Prometheus, and even trace back to GitHub pull requests, to uncover the "why" and "how" behind specific operational behaviors. - Enhanced Defensive Posture: Leveraging metrics for monitoring provides critical visibility for anomaly detection, threat hunting, compliance auditing, and proactive troubleshooting, significantly strengthening the security posture of Kubernetes deployments.
- Beyond Monitoring: Metrics are not just for reactive problem-solving; they are a rich, often underutilized resource for deep, proactive learning and understanding of complex distributed systems like Kubernetes.
About the Speaker(s)
Mario Jason Braganza is an independent consultant based in Bombay, India, specializing in assisting small and medium businesses. He has a keen interest in exploring and understanding complex systems like Kubernetes, as evidenced by his talks at KubeCon, including this one and a previous presentation on Kubernetes Enhancement Proposals (KEPs).
Priyanka Saggu serves as a Kubernetes Integration Engineer at SUSE. She is also an active and prominent member of the Kubernetes upstream project, holding a technical lead position for Kubernetes SIG Contributor Experience. Her work involves deep dives into Kubernetes internals, and she brings this expertise to her presentations, helping others navigate and understand the ecosystem.
Reviews
Dr. Zero (Offensive Security Researcher) — STRONG ACCEPT
This talk presents a highly effective and novel methodology for understanding Kubernetes internals by systematically dissecting its vast metric landscape. The speakers demonstrated how raw operational data points from components like the API server, Kubelet, Scheduler, and Etcd can reveal profound insights into feature enablement, resource management, and complex internal mechanisms. This approach is not just for monitoring but serves as a powerful learning tool, offering practical, actionable knowledge for anyone seeking a deeper, data-driven grasp of Kubernetes.
Heather Calloway (CISO) — STRONG ACCEPT
This KubeCon talk presents a highly credible and practically relevant methodology for understanding Kubernetes by dissecting its operational metrics. It moves beyond theoretical knowledge, offering security leaders and defenders a data-driven approach to identify active attack surfaces, validate configurations, and proactively hunt for threats. The insights derived from metrics like kubernetesfeatureenabled are invaluable for informing governance decisions, ensuring accountability for feature usage, and strengthening the overall defensive posture of critical cloud-native environments.