Nothing to Risk but Risk Itself: Expanding Vulnerability Risk with Internet-Scale Data
Benjamin Edwards (Principal Research Scientist · Bitsite), Sandra Vinberg (Manager · Bitsite)
CVE/FIRST VulnCon 2025 · Main Stage
Overview
In this VulnCon talk, Benjamin Edwards and Sander Vinberg from Bitsite challenge conventional notions of vulnerability risk, advocating for a more comprehensive and data-driven approach that extends beyond traditional metrics. Titled "Nothing to Risk but Risk Itself," a play on FDR's famous quote, the presentation argues that a progressive vision for risk requires shedding preconceived ideas and embracing a richer understanding of contextual factors. The speakers aim to bridge a perceived divide in the security community: between those who champion large-scale data modeling and those who rely on expert, "ethnographic" analysis of individual vulnerability instances.
Key moments
- 0:00 Introduction and defining vulnerability risk
- 1:50 Refined risk definition and measurement goal
- 2:20 Decomposing probability of vulnerability exploitation
- 4:05 Understanding different types of loss from exploitation
- 4:40 Overview of risk measurement frameworks like FAIR
- 6:00 Mentor's quote: 'noise around CUSS vs EPSS'
Nothing to Risk but Risk Itself: Expanding Vulnerability Risk with Internet-Scale Data
Speakers: Benjamin Edwards, Principal Research Scientist, Bitsite; Sander Vinberg, Manager, Product Research, Bitsite
Conference: VulnCon
YouTube: https://www.youtube.com/watch?v=9etNR3iHS1k
Overview
In this VulnCon talk, Benjamin Edwards and Sander Vinberg from Bitsite challenge conventional notions of vulnerability risk, advocating for a more comprehensive and data-driven approach that extends beyond traditional metrics. Titled "Nothing to Risk but Risk Itself," a play on FDR's famous quote, the presentation argues that a progressive vision for risk requires shedding preconceived ideas and embracing a richer understanding of contextual factors. The speakers aim to bridge a perceived divide in the security community: between those who champion large-scale data modeling and those who rely on expert, "ethnographic" analysis of individual vulnerability instances.
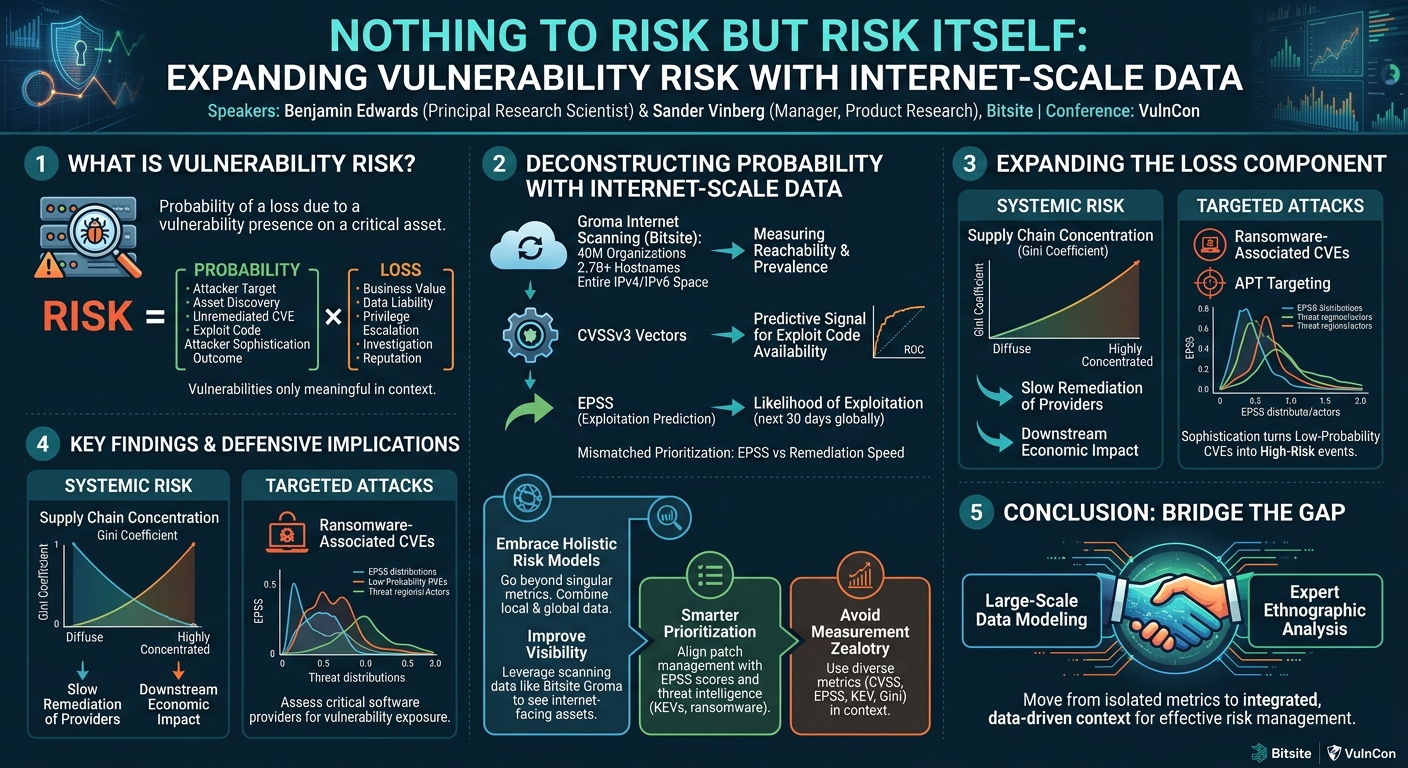
The core thesis of the talk is that effective vulnerability risk management necessitates expanding and refining measurements, integrating both local organizational data and global internet-scale insights. Edwards and Vinberg define vulnerability risk as "the probability of a loss due to the presence of a vulnerability on an asset that someone cares about," and then meticulously decompose both the probability and loss components. By exploring various existing and novel metrics, they demonstrate how a multi-faceted approach, incorporating factors like vulnerability prevalence, remediation time, attacker sophistication, and supply chain dynamics, can yield a more accurate and actionable risk posture for organizations.
This article delves into the methodologies and findings presented by Edwards and Vinberg, offering a detailed technical examination of how internet-scale data can transform vulnerability risk assessment. It highlights the limitations of singular metrics like CVSS and EPSS when viewed in isolation, advocating instead for a holistic framework that contextualizes vulnerabilities within an organization's unique environment and the broader threat landscape. The implications for defenders are significant, urging a shift towards more informed prioritization and proactive risk mitigation strategies.
Background
▶ Watch: Introduction and defining vulnerability risk (0:00)
The concept of "risk" often simplifies to "loss times probability," but in the context of vulnerability management, this becomes far more intricate. Edwards and Vinberg define vulnerability risk as "the probability of a loss due to the presence of a vulnerability on an asset that someone cares about." This definition deliberately uses "asset" broadly, encompassing devices, web pages, and services, and "loss" generically, covering monetary loss, service disruption, or data liability. The speakers then refine "possibility" to "probability" to align with their data science methodology.
To measure this probability of loss, a granular decomposition is necessary. The probability component hinges on several preconditions: an attacker must target the organization, find a vulnerable asset with a specific CVE, the vulnerability must be unpatched, exploit code must exist, the attacker must possess sufficient sophistication to execute the exploit, and the exploit must achieve the attacker's desired outcome. The loss component is equally complex, encompassing immediate impacts like business value lost due to downtime and data liability, as well as downstream consequences such as escalation of privilege, lateral movement, investigation and recovery costs, and the often-difficult-to-quantify reputational damage.
Several frameworks exist to guide organizations in assessing and managing risk, moving from abstract concepts to concrete measurements. The Factor Analysis of Information Risk (FAIR) is highlighted as a robust hierarchy for plugging in observations to generate scores. Other notable frameworks include OCTAVE, the NIST Cybersecurity Framework (CSF), MITRE Threat Assessment and Remediation Analysis (TARA), and ISO 31K/27K1. Critically, the speakers emphasize that all these frameworks "require you to bring your own measurements"—they are organizational decision-guidance tools, not sources of ground truth data about vulnerabilities themselves.
A central tension in the vulnerability management community is underscored by a mentor's quote: "There's so much noise around CUSS versus EPSS versus some random formula... Vulnerabilities are only meaningful in context and low, medium, high, who cares? I've seen pentesters and attacks stitch a bunch of low vulnerabilities together and pop a box." While acknowledging the danger of deriving general frameworks from anecdotal observations, the speakers embrace the emphasis on context. They position this as a divide between those who believe in large-scale data modeling and those who advocate for "ethnographic" expert analysis of every vulnerability instance on every asset. The talk's core mission is to bridge this gap, demonstrating that context can be achieved at scale through expanded and refined measurements.
Current methods for assessing vulnerability risk are then reviewed. CVSS (Common Vulnerability Scoring System), despite its technical severity focus and its own creators stating it's not a measure of risk, is presented controversially by Edwards as "good, actually." He argues that its base vector metrics (e.g., network accessibility, access complexity, privileges required) provide useful first-order risk signals, especially given its low information requirements for scoring. However, its subjectivity and score compression (100 scores for 6,000 vectors) often lead to debates over rank.
Another framework, SSVC (Stakeholder-Specific Vulnerability Categorization), developed by CISA and Cert-CC, is identified as a risk assessment framework, not a direct measure of risk itself. It provides decision points for action (act or track) but requires external data inputs.
EPSS (Exploitation Prediction Scoring System), with its latest version 4 recently launched, is lauded as a robust measure of a subcomponent of vulnerability risk: the likelihood that a CVE will be exploited anywhere in the world within the next 30 days. EPSS models vulnerabilities based purely on their characteristics, using actual exploitation events as training data, but its runtime inputs do not involve threat actors or observed attacks. The distribution of EPSS scores is noted to be heavily skewed, with the vast majority being very low (mode around 0.5%) and a small "peak towards the end" for highly exploitable vulnerabilities.
Known Exploited Vulnerabilities (KEVs) lists, such as the CISA KEV catalog, provide historical exploitation data. While useful, the speakers caution that historical exploitation does not necessarily predict future exploitation, making them imperfect predictors of future risk.
MITRE ATT&CK framework, designed for standardized communication about attacker behaviors, is deemed "not great for managing risk around vulnerabilities" and "certainly not a measure of vulnerability risk." Mapping CVEs to ATT&CK techniques is laborious, and even perfect mappings still require internal organizational experts to assess the impact of specific attack chains.
Finally, the concept of software criticality is explored. While difficult to measure at scale externally, the criticality of security software itself (e.g., Palo Alto WAF, F5 BIG-IP, Fortinet, SonicWall SSLVPN) is evident from frequent exploitation news. However, this is seen as an imperfect predictor for vulnerability prioritization, requiring more granular signal. These existing measures form the baseline upon which Edwards and Vinberg propose to build a more expansive risk assessment model.
Key Findings
▶ Watch: Decomposing probability of vulnerability exploitation (2:20)
The talk's central contribution is the demonstration that a more comprehensive and contextual understanding of vulnerability risk is not only necessary but also achievable through the integration of diverse, internet-scale data. The key findings presented are:
- CVSS as a Predictive Signal: Despite its limitations and its official designation as a "technical severity" score, CVSSv3 base vectors do contain predictive signal for exploit code availability. A gradient boosted tree model built by Edwards showed that CVSS vectors could predict proof-of-concept (POC) code exploitation, indicating its value as an early, rough measure of risk that requires minimal external information.
- EPSS Distribution and Prioritization Disconnect: The majority of vulnerabilities have very low EPSS scores (mode ~0.5%), with a small, distinct peak representing highly exploitable CVEs. While organizations tend to remediate high-CVSS vulnerabilities faster, there is no significant correlation between remediation time and EPSS scores. This highlights a critical disconnect where organizations are not prioritizing fixes based on the imminent likelihood of exploitation, leaving many high-EPSS vulnerabilities unpatched for extended periods.
- Vulnerability Prevalence and Asset Footprint: Measuring "new detections per month" provides a more reliable indicator of a vulnerability's prevalence than total detections. Most CVEs exhibit relatively low prevalence (100-1,000 new detections/month), though outliers like jQuery 3.0 (a cross-site scripting vulnerability from 2015) can appear millions of times monthly. The relationship between an organization's size (employees) and its overall CVE footprint is present but weaker than expected; many large organizations have surprisingly few CVEs, while some small ones have many.
- Attacker Sophistication and Targeting: Advanced Persistent Threats (APTs) utilize a relatively low subset of KEVs, and some APTs are observed using vulnerabilities with low EPSS scores, suggesting that sophistication can turn a low-likelihood vulnerability into a high-risk event. Analysis of regional threat actors revealed differing EPSS score distributions for the CVEs they target, with some (e.g., Middle Eastern, NATO allies) focusing heavily on high-EPSS vulnerabilities, while others (e.g., "other actors," Russian) show distributions closer to the overall CVE population.
- Ransomware as a Direct Loss Indicator: Ransomware-associated CVEs provide a clear, immediate measure of loss. KEV lists offer partial insight into ransomware exploitation, but a dedicated focus on vulnerabilities known to be used by ransomware gangs adds crucial context for prioritization.
- Organizational Footprint and Exposure: Larger organizations (by employee count) face a significantly higher likelihood (up to 70%) of having detectable exposure to KEVs, ransomware-exploited CVEs, or APT-exploited CVEs. However, even small organizations with minimal asset footprints can still have detectable exposure, demonstrating that no entity is immune.
- Software Proliferation (Pearls) and Exploitation: A linear relationship exists between the number of affected software packages (Package URLs or Pearls) and the number of new CVE detections. However, surprisingly, there is no strong relationship between Pearl distribution and EPSS (exploitation likelihood). This suggests that a vulnerability being widespread across many software packages doesn't inherently make it more likely to be exploited.
- Vulnerability Concentration (Gini Coefficient): Applying the Gini coefficient to CVE distribution across organizations reveals a bimodal distribution: one mode around 0.3 (diffuse, evenly spread) and another around 0.7 (highly concentrated in a few organizations). Highly concentrated vulnerabilities (high Gini) tend to be remediated faster (around 25 days median vs. 50 days for diffuse ones), likely because a single major provider fixing an issue can resolve many instances. However, high concentration also means significantly higher risk for the few organizations holding those vulnerabilities.
- Systemic Supply Chain Risk: Analysis of major software and service providers (those with >10% market share) reveals significant systemic risk. Some of these critical suppliers exhibit long remediation times (>200 days) and high detection rates (vulnerabilities detected on ~1% of their assets annually). This highlights that an incident at a major supplier can have severe downstream consequences across the global economy.
These findings collectively argue for a departure from isolated risk metrics towards an integrated, context-rich assessment that leverages both internal organizational data and broad internet-scale observations to inform vulnerability management decisions.
Technical Deep Dive
▶ Watch: Understanding different types of loss from exploitation (4:05)
The technical foundation of Edwards and Vinberg's talk rests on a multi-faceted approach to measuring vulnerability risk, integrating both local (organizational) and global (internet-scale) data points. Their methodology begins with a precise definition of vulnerability risk: "the probability of a loss due to the presence of a vulnerability on an asset that someone cares about." This is then rigorously decomposed into its constituent elements of probability and loss.
The probability of exploitation is broken down into a chain of preconditions:
- Attacker Target: An attacker decides to target a specific organization.
- Vulnerable Asset Discovery: The attacker successfully finds an asset within that organization vulnerable to a specific CVE.
- Unremediated Vulnerability: The vulnerability remains unpatched.
- Exploit Code Existence: Exploit code for the CVE is available.
- Attacker Sophistication: The attacker possesses the necessary skills to utilize the exploit code.
- Successful Exploitation & Outcome: The exploit is successful and achieves the attacker's desired objective.
The loss component is similarly detailed, covering direct business value loss (e.g., downtime), data liability, the costs associated with privilege escalation and lateral movement, and the long-term expenses of investigation, recovery, and reputational damage.
A key technical argument is the re-evaluation of CVSSv3 as a risk signal. While officially a measure of technical severity, Edwards demonstrates that its base vector metrics—such as network accessibility (versus physical access), low access complexity (e.g., a race condition), and lack of required privileges or user interaction—are inherently correlated with the likelihood of exploitation. To validate this, a gradient boosted tree model was constructed to predict the availability of Proof-of-Concept (POC) exploit code based on the CVSSv3 vector. The Receiver Operating Characteristic (ROC) curve for this model, showing a distinct upward trend away from the random baseline, indicates that CVSS does provide a predictive signal for exploit code availability, making it a valuable early-stage risk indicator.
EPSS (Exploitation Prediction Scoring System) is presented as a robust, specialized measure focusing on the likelihood of a CVE being exploited anywhere globally within the next 30 days. Its predictive power comes from supervised learning, where actual exploitation events serve as training labels. Crucially, EPSS models vulnerabilities solely on their inherent characteristics, meaning runtime inputs do not include real-time threat actor or observed attack data. The distribution of EPSS scores is highly skewed, with the mode around 0.5% and a long tail extending to nearly 100%, indicating that a small fraction of vulnerabilities accounts for a disproportionately high exploitation probability.
The analysis heavily relies on Bitsite's internet scanning platform, Groma. Described as a proprietary system akin to Shodan but with different architectural and coverage characteristics, Groma provides data on over 40 million organizations, 2.7 billion hostnames, 4.9 billion IPv4 addresses (covering the entire IPv4 space), and 600 million IPv6 addresses. The speakers highlight Groma's utility as a "quick and dirty reachability analysis": if Groma can fingerprint a CVE on an asset, an attacker likely can too. Additional data sources include Cyber Six for cyber threat intelligence from the deep and dark web, and the Empirical Security Global Model, which provides a transformed version of the EPSS training data.
For measuring vulnerability prevalence, the metric "new detections per month" is favored over total detections to avoid biases from scan cadence and vulnerability age. This revealed that most CVEs have between 100 and 1,000 new detections monthly, with notable exceptions like jQuery 3.0 (a cross-site scripting vulnerability) showing millions of detections, often due to widespread use on web hosting platforms.
Remediation time is quantified using median remediation time derived from survival curves across approximately 16,000 scanned CVEs. This metric represents the time taken for organizations to fix 50% of vulnerable instances. While the median is about 1 to 1.5 months, some vulnerabilities persist for years (e.g., SSL vulnerabilities like POODLE), often due to firmware updates or the need to take systems offline.
The talk introduces attacker sophistication into the risk equation by analyzing KEVs used by Advanced Persistent Threats (APTs). This involved cross-referencing KEVs with threat intelligence indicating APT exploitation. Regional analysis of EPSS scores for CVEs used by different threat actors (e.g., Russian, Middle Eastern, NATO allies, cybercrime) revealed distinct targeting patterns. For example, Middle Eastern and NATO-aligned actors showed a stronger focus on high-EPSS vulnerabilities, while others exhibited a distribution closer to the overall EPSS landscape, suggesting that even low-EPSS vulnerabilities might be targeted by sophisticated actors.
To assess vulnerability concentration, the economic Gini coefficient is adapted. This coefficient measures the inequality of resource distribution (in this case, CVE detections) across a population (organizations). A low Gini coefficient (e.g., 0.3) indicates even distribution (e.g., Microsoft Exchange vulnerabilities where each on-prem user has one instance), while a high Gini coefficient (e.g., 0.7) signifies high concentration (e.g., a Grafana cross-site request forgery CVE where a few cloud providers account for 80% of detections). The Gini coefficient calculation involves ordering organizations by their resource count and plotting cumulative percentages. The analysis revealed a bimodal distribution of Gini coefficients across CVEs, indicating both diffuse and highly concentrated vulnerability patterns.
Finally, supply chain risk is quantified by correlating a provider's market share (percent of global economy customers) with their normalized vulnerability detections per asset, asset footprint, and remediation time. This allows for the identification of critical suppliers with substantial market influence, high vulnerability rates, and slow remediation, posing significant systemic risk to the broader digital ecosystem. Examples like CrowdStrike incidents are cited to illustrate the downstream impact of such risks.
Demo / Proof of Concept
▶ Watch: Overview of risk measurement frameworks like FAIR (4:40)
The talk focused heavily on analytical findings, models, and data visualizations rather than live demonstrations or proof-of-concept code. The speakers presented numerous plots and histograms derived from their extensive data, illustrating correlations and distributions of various vulnerability metrics.
However, they did mention a publicly accessible tool developed by Bitsite: Groma Explorer. This platform serves as a "mini-Showdan," allowing users to search for CPE (Common Platform Enumeration) or CVE IDs to see how many instances Bitsite's Groma internet scanning platform detects at any given time. While not a live demo during the presentation, Groma Explorer functions as a publicly available proof of the visibility and detection capabilities discussed in the talk, enabling users to interact with internet-scale vulnerability data.
The absence of a traditional code-based or live exploitation demo does not detract from the technical depth of the presentation, which primarily aimed to elucidate novel measurement methodologies and their implications through statistical analysis and data-driven insights.
Defensive Implications
▶ Watch: Mentor's quote: 'noise around CUSS vs EPSS' (6:00)
The detailed analysis presented by Edwards and Vinberg offers several crucial defensive implications for organizations striving to improve their vulnerability management posture:
- Embrace a Holistic Risk Model: Defenders must move beyond relying on single, isolated metrics like CVSS scores or even EPSS. True vulnerability risk is a complex interplay of probability (discoverability, exploitability, attacker sophistication, time to patch) and loss (business impact, data liability, potential for lateral movement, reputational damage, ransomware costs). A low-probability vulnerability, if exploited by a sophisticated attacker or leading to a high-impact event like ransomware, can still pose significant risk.
- Integrate Diverse Data Sources: Effective risk management requires combining both local organizational measurements and global internet-scale data.
- Local Data: Understand your actual vulnerability prevalence (what CVEs are truly in your footprint), your organization's typical remediation times, the sophistication of threat actors targeting your environment, and the specific loss types (e.g., ransomware) that pose the greatest threat to you.
- Global Data: Leverage insights from the broader internet, such as general EPSS trends, overall vulnerability concentration patterns (Gini coefficient), proliferation across software packages (Pearls), and the security posture of your critical supply chain providers.
- Rethink Prioritization Beyond CVSS: While CVSS offers an early signal, current remediation prioritization heavily skewed towards high-CVSS scores does not align with the actual likelihood of exploitation (EPSS). Defenders should integrate EPSS scores into their prioritization schemes to focus on vulnerabilities with imminent exploitation probability, even if their CVSS score is not the absolute highest. Furthermore, consider the inherent difficulty and time required to fix specific vulnerabilities (e.g., firmware updates vs. simple patches) when planning remediation efforts.
- Account for Attacker Sophistication and Intent: Recognize that not all threats are equal. Vulnerabilities targeted by APTs or associated with ransomware pose a higher, more direct risk, regardless of their general EPSS score or prevalence. Defenders should prioritize patching CVEs known to be exploited by sophisticated actors or linked to high-impact attack campaigns.
- Understand and Mitigate Supply Chain Risk: Organizations are increasingly reliant on third-party software and services. Defenders must assess the vulnerability management practices of their critical suppliers, especially those with significant market share. If a major provider exhibits slow remediation times or high vulnerability detection rates, this represents a systemic risk that directly impacts downstream customers. Advocate for improved security from these suppliers and implement contingency plans. If your organization is a major supplier, prioritize rapid remediation to protect your customers and maintain trust.
- Avoid "Measurement Zealotry": No single metric provides a complete picture of risk. Defenders should resist the temptation to fixate on one score or framework. Instead, combine insights from CVSS, EPSS, KEV lists, ATT&CK, internal asset criticality, observed attacker behaviors, and internet-scale prevalence data to construct a robust, multi-dimensional risk assessment.
- Enhance Visibility and Data Sharing: The ability to perform these advanced analyses hinges on reliable visibility and standardized data. Organizations should actively contribute to and leverage shared data sources (e.g., CISA KEV, EPSS, Shodan, Shadow Server, Bitsite's Groma Explorer, and the CVE system). The CVE system, despite its flaws, is critical for ensuring that security practitioners are "all talking about the same thing," enabling systematic measurement and analysis.
By adopting these defensive strategies, organizations can move towards a proactive, context-aware vulnerability management program that more accurately reflects their true risk exposure and enables more effective resource allocation for remediation.
Key Takeaways
- Vulnerability risk is a complex interplay of probability and loss, requiring a holistic understanding that goes beyond simplistic calculations or single metrics.
- Context is paramount for effective vulnerability management, and it can be achieved at scale by expanding and refining measurements, rather than relying solely on expert ethnographic analysis.
- Integrate both local (organizational) data (e.g., asset footprint, remediation speed, specific threats targeting your environment) and global (internet-scale) data (e.g., EPSS scores, vulnerability prevalence, concentration patterns, supply chain posture) for a comprehensive risk picture.
- While CVSS provides an early, rough measure of technical severity that can predict exploit code availability, and EPSS offers robust predictions of imminent exploitation, neither is sufficient on its own. Combine these with KEVs, attacker intelligence, and asset criticality for nuanced prioritization.
- Organizations often fail to align remediation speed with actual exploitation likelihood (EPSS scores), prioritizing based on CVSS instead. This creates critical windows of exposure for highly exploitable vulnerabilities that are slow to fix.
- Systemic factors, such as the Gini coefficient revealing vulnerability concentration and the security posture of critical supply chain providers, significantly impact an organization's risk profile and require attention.
- Avoid "measurement zealotry"—no single metric or framework provides a complete answer. A multi-faceted approach, leveraging diverse data and insights, is essential for informed vulnerability risk management.
About the Speaker(s)
Benjamin Edwards is a Principal Research Scientist at Bitsite. His work focuses on leveraging data science and internet-scale observations to expand the understanding and measurement of cybersecurity risk, particularly in the realm of vulnerabilities.
Sander Vinberg is a Manager in the Product Research organization at Bitsite. He is involved in translating research findings into actionable product insights and strategies, helping organizations better manage their vulnerability risk based on empirical data.
Reviews
Dr. Zero (Offensive Security Researcher) — SOLID
Edwards and Vinberg are doing legitimate empirical work — the Gini coefficient application to CVE concentration is genuinely clever, the EPSS-versus-remediation-speed disconnect is a finding worth hearing, and the supply chain risk quantification using market share against patch velocity is the kind of thing practitioners should be thinking about. The internet-scale dataset (Groma's 4.9B IPv4 addresses, 40M orgs) gives them a real empirical foundation that most vulnerability management talks don't have. But this is squarely a 3-star talk: solid, competent, grounded in actual data — and not much more than that. The framing is 'use more signals together' and every individual insight, while…
Heather Calloway (CISO) — SOLID
Edwards and Vinberg deliver credible, data-rich research on vulnerability risk modeling that advances the measurement conversation meaningfully. The framework decomposition is rigorous, the novel metrics — Gini coefficient applied to CVE concentration, supply chain systemic risk quantification, the EPSS/remediation-speed disconnect — are genuinely useful signals. But the talk is built for vulnerability researchers and technically sophisticated practitioners, not for the security leaders and program operators who most need to change behavior. The institutional accountability gap is real: the research identifies that organizations remediate based on CVSS rather than EPSS, that critical…